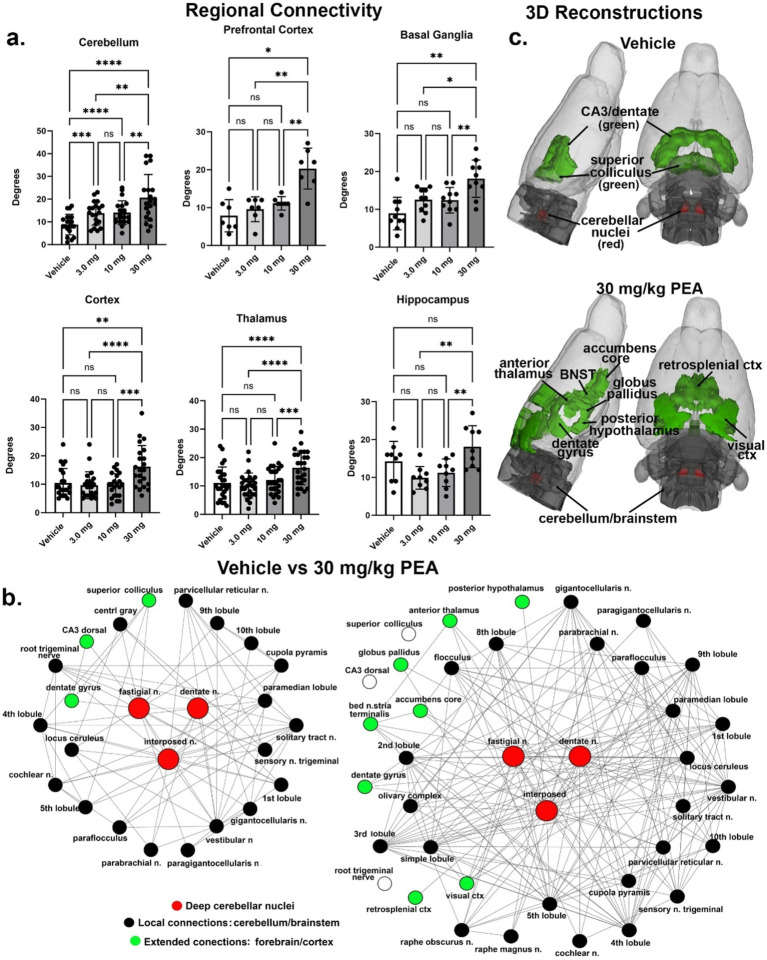
Figure 4.
Functional connectivity. Shown in (A) are the number of degrees for the four main brain regions: primary somatosensory cortices, thalamus, prefrontal cortex, and basal ganglia. (B) Shows the radial representations of the connections or degrees (lines) to the three cerebellar nuclei (center red), e.g., fastigial, dentate and interposed following vehicle or 30 mg/kg PEA treatment. The black dots are brain areas within the cerebellum and immediate brainstem. Green dots are brain areas outside the hindbrain and more rostral. Note with PEA treatment the number of green dots increase as the deep cerebellar nuclei extent their connections to include visual cortex, accumbens and anterior thalamus as examples. (C) Is a 3D reconstruction of these brain areas colored coded black and green for vehicle and PEA treatments. All brain areas highlighted have direct connections to the cerebellar nuclei under each experimental condition. The significant difference in connectivity (Student t-test, ****p < 0.0001) is shown in the inserted bar graph at the center of the figure. *p < 0.05; **p < 0.01; ***p < 0.001.

