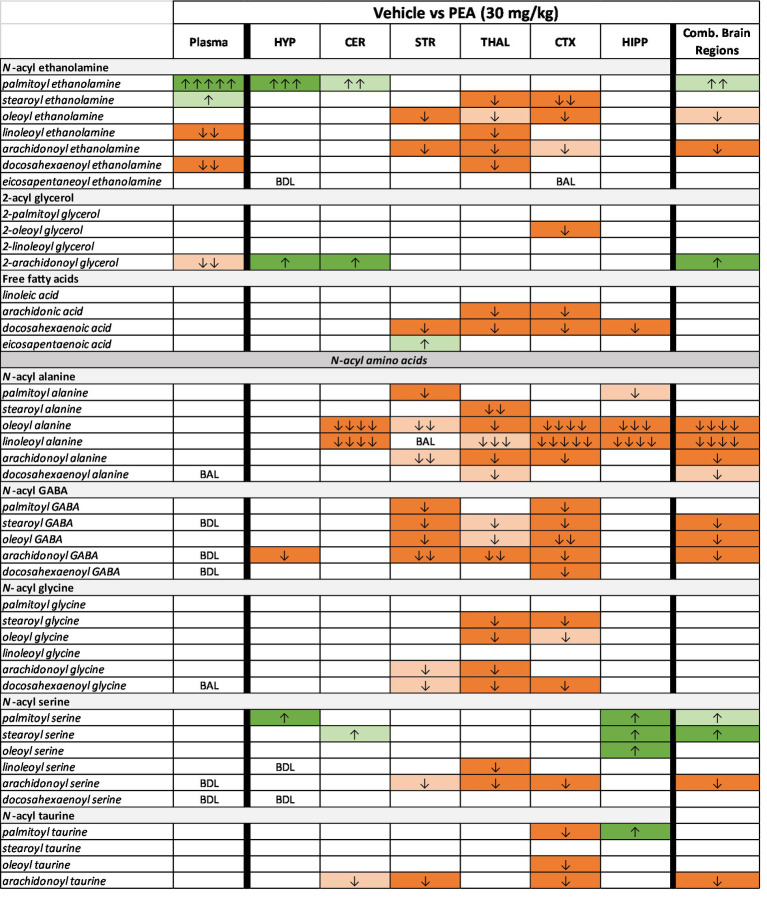
Figure 6.
Heatmap of selected lipids in plasma and CNS after acute 30 mg/kg PEA injection. Analysis that supports the heatmap output is outlined in detail in the Methods. Data are shown as the levels of lipids in the 30 mg/kg PEA injected subjects compared to the vehicle control. Dark orange indicated significantly (p < 0.05) reduced levels of a specific lipid in the PEA group and light orange significance is p < 0.1–0.051. Likewise, dark and light green indicate significant increases of the specific lipid in the PEA group compared to the vehicle group. Arrows indicated fold-change. See Methods for key. BDL = below detectable limits. BAL = below analytical limits, which means that some samples had clearly discernible chromatographic peaks for the lipid and others did not and the overall levels were below the number needed for statistical Power to make a clear determination.

