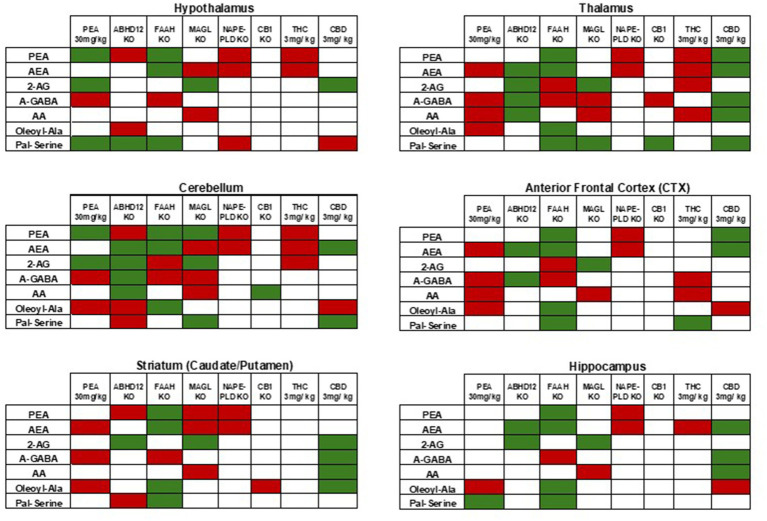
Figure 7.
Comparisons of levels of selected CNS lipids in KO models and cannabinoid treatments to current PEA injection. As described in the Discussion, these comparisons are generated from previous reports (see references in text). Here, green indicates significant increases and red indicates significant decreases. In each case, the relative differences are either to baseline WT or vehicle depending on the study. Data from the current study of acute 30 mg PEA/kg is in the far-left column in each table. Tables are separated by CNS areas and the specific area is represented as a label at the top of each table.

