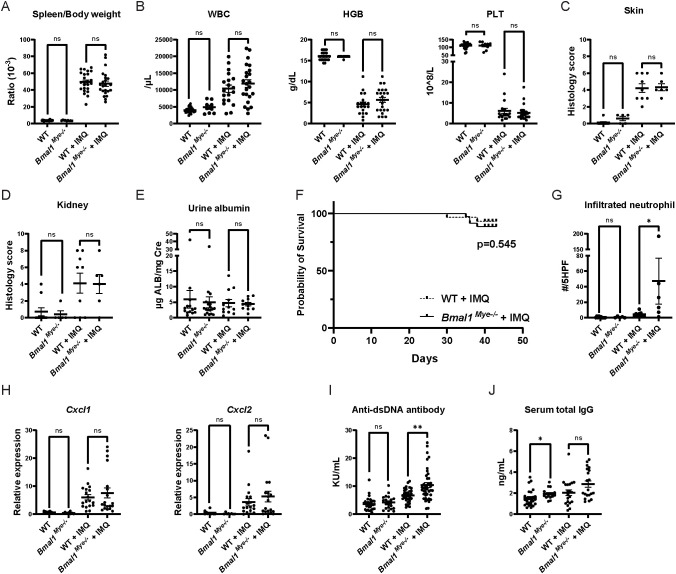
Figure 1.
Lupus phenotype triggered by imiquimod in Bmal1Mye−/− and WT mice. (A) Spleen weight corrected by body weight in untreated and imiquimod (IMQ)-treated wild type (WT) and Bmal1Mye−/− mice. WT; n=25, Bmal1Mye−/− ; n=9, WT + IMQ; n=24, Bmal1Mye−/− + IMQ; n=23. (B) Complete blood count (CBC) of peripheral blood. WT; n=25, Bmal1Mye−/− ; n=9, WT + IMQ; n=24, Bmal1Mye−/− + IMQ; n=23. (C, D) Histology inflammation score in skin and kidney, respectively. WT; n=10, Bmal1Mye−/− ; n=5, WT + IMQ; n=9, Bmal1Mye−/− + IMQ; n=6. (E) Urine albumin/creatinine ratio. WT; n=14, Bmal1Mye−/− ; n=18, WT + IMQ; n=12, Bmal1Mye−/− + IMQ; n=11. (F) Survival rates analyzed by the Kaplan–Meier curve. WT + IMQ; n=29, Bmal1Mye−/− + IMQ; n=35. (G) Number of neutrophils per five high-power fields (HPF) of H&E staining in lesional skin. WT; n=10, Bmal1Mye−/− ; n=5, WT + IMQ; n=9, Bmal1Mye−/− + IMQ; n=6. (H) Chemokine expression levels in skin (ear) lesion. Expression levels of the C–X–C motif chemokine ligand (Cxcl) 1 and Cxcl2 were assessed by qPCR. WT; n=10, Bmal1Mye−/− ; n=8, WT + IMQ; n=18, Bmal1Mye−/− + IMQ; n=19. (I, J) Serum concentration of anti-ds DNA and total IgG, respectively. WT; n=25, Bmal1Mye−/− ; n=16, WT + IMQ; n=20, Bmal1Mye−/− + IMQ; n=20. Bars in the graphs represent mean + SEM. The statistical analysis was done using unpaired t-test for spleen weight, CBC, urine albumin, and qPCR and Mann–Whitney test for histology score, infiltrated neutrophil count, anti-ds DNA antibody, total IgG. Log-rank test was used for survival rate analysis. *p<0.05, **p<0.01, ns, not significant. WBC, white blood cell; HGB, hemoglobin; PLT, platelet.

