Figure 2.
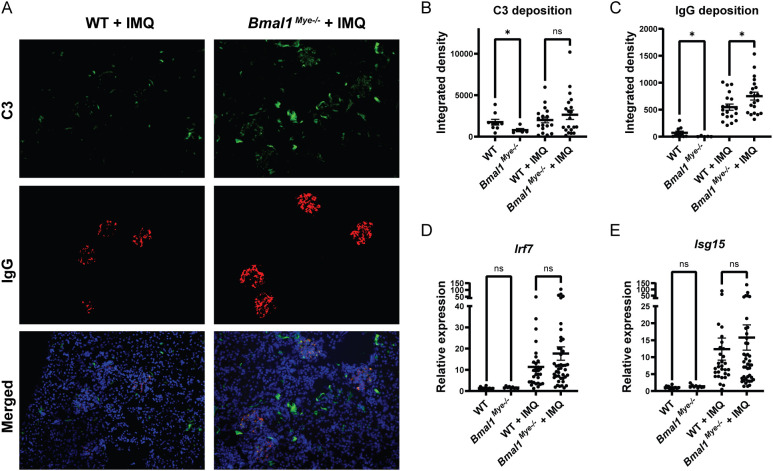
Immune complex deposition and inflammatory response in kidneys are modulated by Bmal1. (A) Representative images of kidney immunofluorescent staining of immune complex deposition. C3 (green), IgG (red), and Hoechst (blue). (B, C) Fluorescent intensity of C3 and IgG, respectively, quantified by ImageJ software. WT; n=9, Bmal1Mye−/− ; n=5, WT + IMQ; n=19, Bmal1Mye−/− + IMQ; n=20. (D, E) Expression levels of interferon regulatory factor (Irf)7 (D) and interferon-stimulated gene (Isg)15 (E) were assessed by qPCR. WT; n=15, Bmal1Mye−/− ; n=9, WT + IMQ; n=30, Bmal1Mye−/− + IMQ; n=43. Bar graphs represent mean + SEM. The statistical analysis was done using unpaired t-test for qPCR results, and Mann–Whitney test for immune complex deposition. *p<0.05, ns, not significant.

