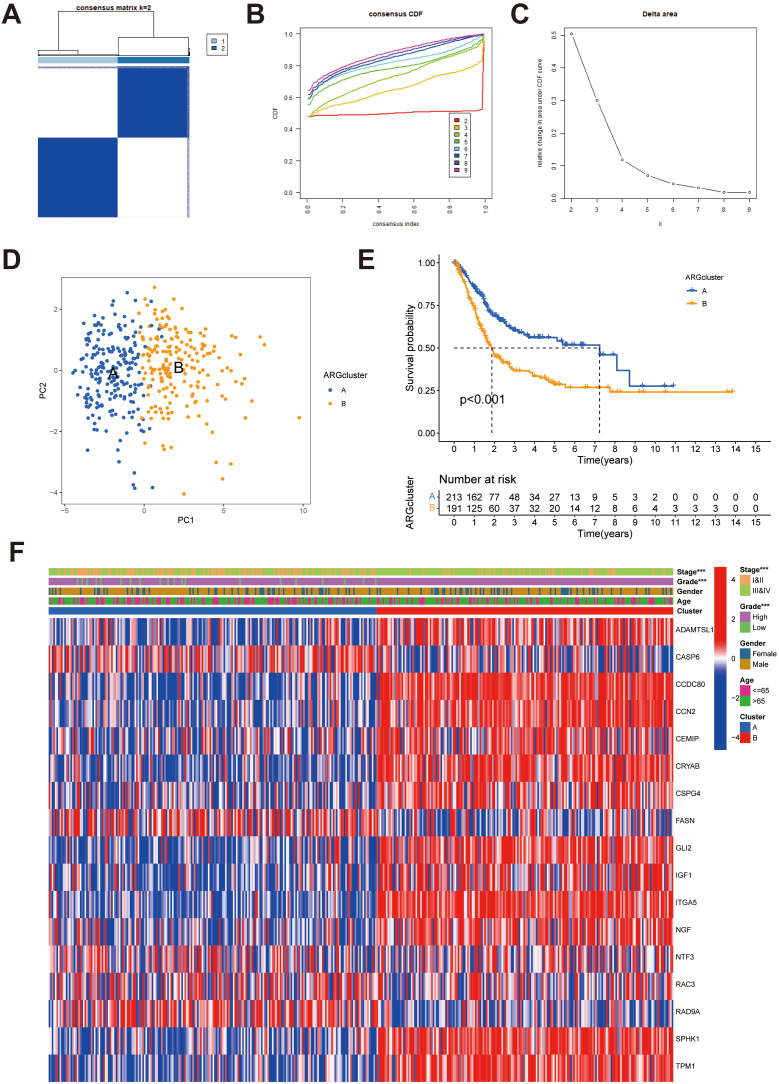
Figure 2.
Identification of potential anoikis subgroups in BLCA. (A) Two anoikis subgroups (k = 2) and their correlation area are defined by consensus matrix heatmap. (B) The consensus clustering CDF. (C) The analysis of the variation in area under the CDF region. (D) PCA indicated the different distributions between the potential anoikis subgroups. (E) Survival analyses for the ARGcluster A (n = 213) and ARGcluster B (n = 191) cohorts. (F) Differences in clinical characteristics and expression levels of candidate ARGs between ARGcluster A and ARGcluster (B) BLCA, Bladder cancer; CDF, cumulative distribution function; ARGs, anoikis-related genes. ***P < 0.001.

