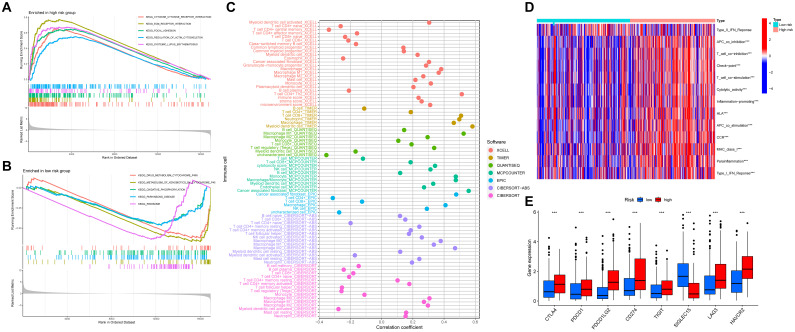
Figure 7.
The relationship between the anoikis-related model and the immune status. (A, B) GSEA indicates the functional pathways in the high- and low-risk groups. (C) The Spearman correlation analysis of immune components and the risk score based on different algorithms. (D) The heatmap showing the association with the risk-scores and immune-related functions. (E) The expression levels of immune checkpoints between high- and low-risk groups. ***P<0.001.

