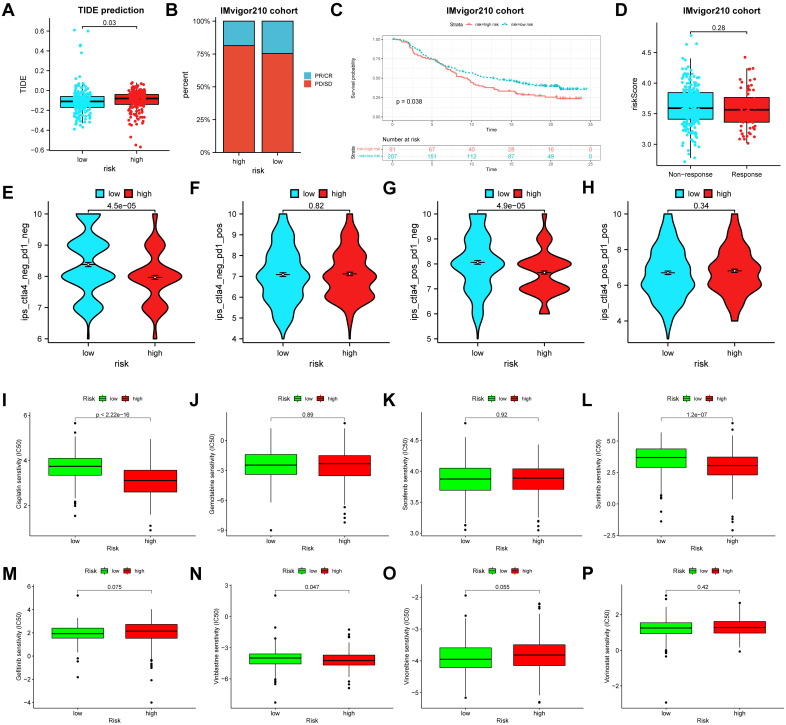
Figure 8.
The relationships between the risk score and the tumor immunotherapy and chemotherapeutic sensitivity. (A) The TIDE scores between the high- and low-risk groups. (B) The proportion of BLCA patients with response to immunotherapy in two risk groups in the IMvigor210 cohort. (C) Survival analyses for BLCA patients with high or low risk score in the IMvigor210 cohort. (D) Differences in risk scores between the responders and non-responders in the IMvigor210 cohort. (E-H) Differences in the IPS between high- and low-risk groups stratified by CTLA4 and PD-1. (I-P) Relationships between the risk score and the chemotherapeutic sensitivity. TIDE, tumor immune dysfunction and exclusion; BLCA, bladder cancer. IPS, immunophenoscore.

