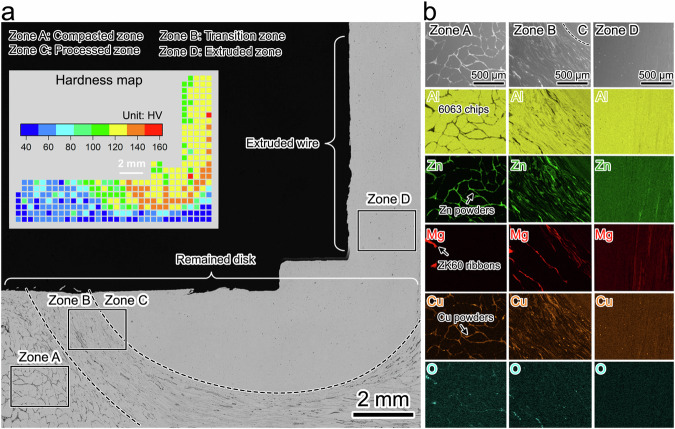
Fig. 3. Microstructural evolution during solid-phase alloying.
a Optical image displaying four distinct regions from bottom to top—Zone A: compacted scrap, powders, and ribbons. Zone B: deformed materials transition from compacted microstructure to processed microstructure. Zone C: mixed and alloyed microstructure. Zone D: extruded microstructure. Note the hardness map inset in (a), covering the span from Zone A to Zone D. b SEM and EDS mapping of Al, Zn, Mg, Cu, and O (from top to bottom) at Zone A, Zone B, and Zone D (from left to right).

