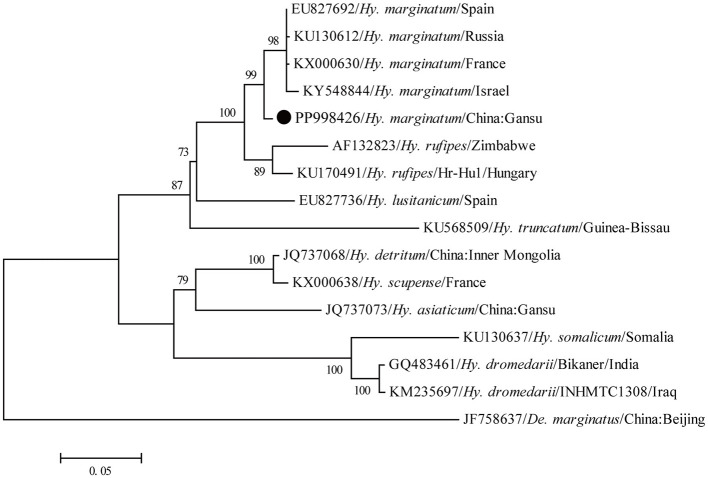
Figure 2.
Molecular identification of ticks based on the phylogenetic analysis with the COI gene. The maximum-likelihood (ML) tree was reconstructed using the MEGA 6.0.6 under the GTR+G+I model with 1,000 replicates. The numbers at each node indicated bootstrap values, and only bootstrap values >70% are shown at appropriate nodes. Taxa marked by circles depict representative sequences obtained in this study.

