FIGURE 2.

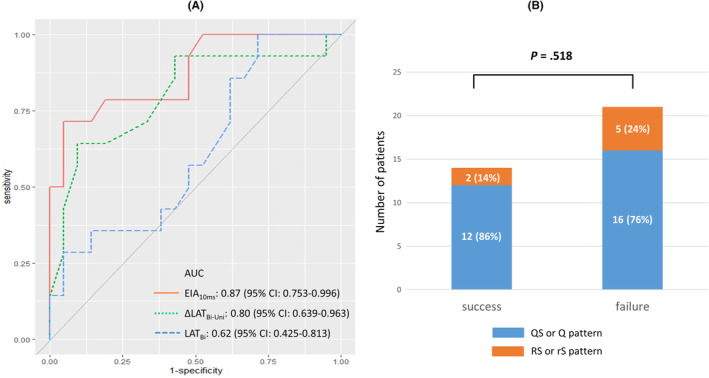
Receiver‐operating characteristic curve of indicators of ablation success (A) and unipolar morphology between success and failure groups (B). AUC, area under the curve; CI, confidence interval.

Receiver‐operating characteristic curve of indicators of ablation success (A) and unipolar morphology between success and failure groups (B). AUC, area under the curve; CI, confidence interval.