
FIGURE 2.
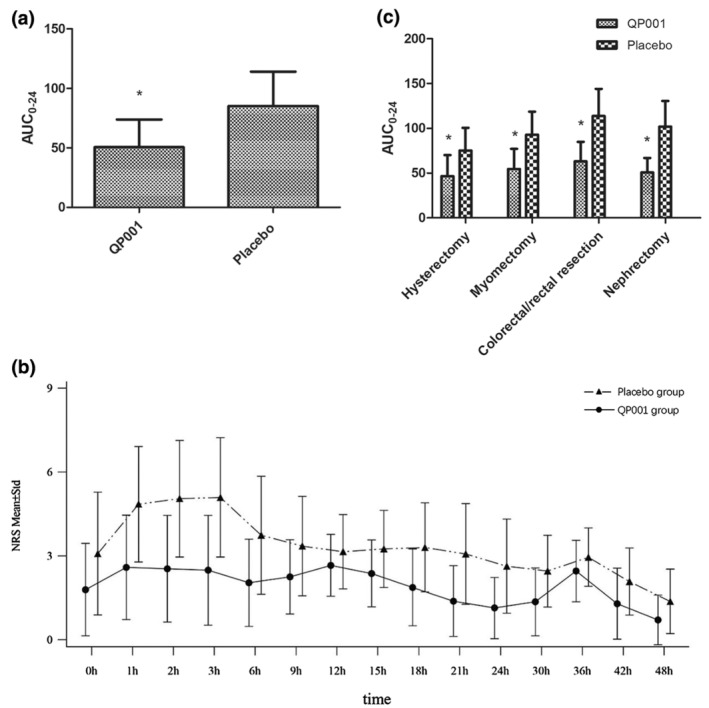
The AUC0–24 in the QP001 group was significantly decreased than that of the placebo group. (a) The AUC0–24 in the QP001 group was significantly decreased than the placebo group. (b) At each time point within 48 h the pain intensity‐time curve in the QP001 group was significantly lower than that of the placebo group. (c) Subgroup analysis showed that the AUC0–24 of each subgroup in the QP001 group was significantly reduced than the placebo group. AUC, area under curve; NRS, numerical rating scale. The data are expressed as the means ± SD. *p < 0.01 versus the Placebo group.