
FIGURE 4.
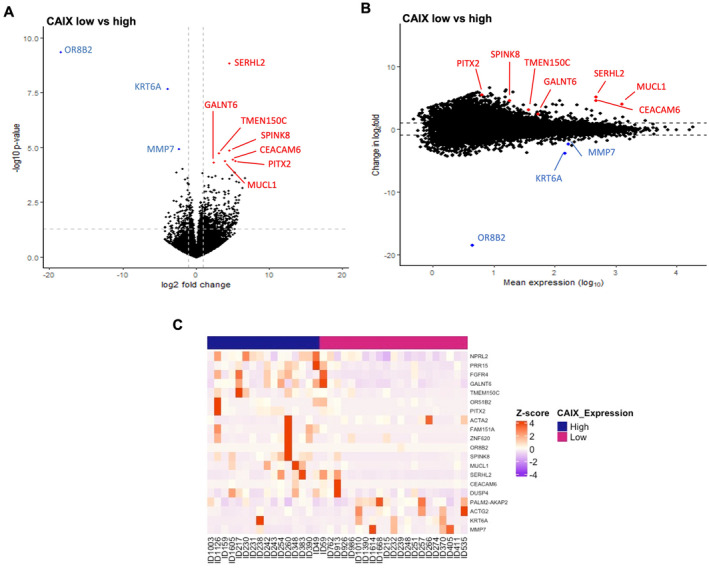
Differential expression gene analysis in ER‐negative cohort relative to cytoplasmic CAIX expression groups. (A) Volcano plot showing the distribution of gene expression fold changes and p values between patients with high and low cytoplasmic CAIX. (B) MA plot showing 10 DEGs comparing high and low cytoplasmic CAIX expression tumours. Red means upregulated and blue means downregulated genes. (C) Heatmap of the top 20 DEGs between low (pink) and high (blue) cytoplasmic CAIX protein expression.