
FIGURE 5.
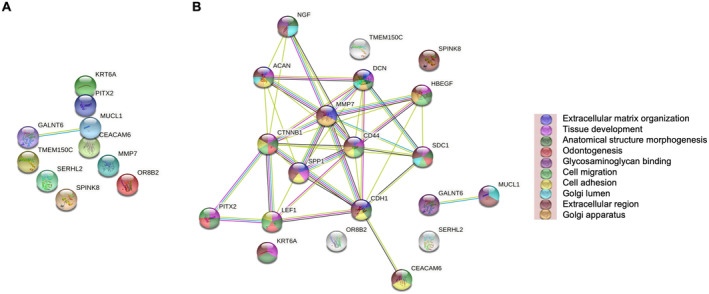
Protein–protein interaction of differential expression genes in ER‐negative cohort. STRING interaction network diagram showing relationships between DEGs from full transcriptional sequencing on a subset of the ER‐negative cohort, (A) PPI network analysis for 10 proteins, (B) PPI network analysis for extra added 10 proteins.