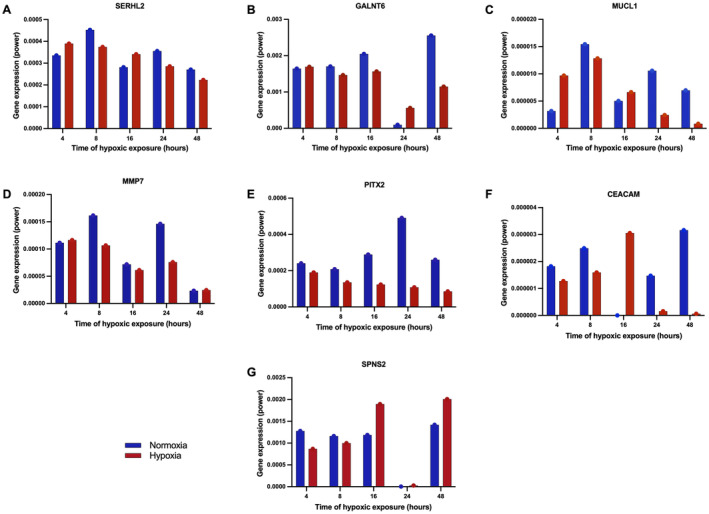
FIGURE 8.

Differentially expressed genes validated by RT‐qPCR. Expression levels of genes in normoxic and hypoxic MDA‐MB‐231 cells at different time points, 4, 8, 16, 24, and 48 h: (A) SERHL2, (B) GALNT6, (C) MUCL1, (D) MMP7, (E) PITX2, (F) CEACAM6 and (G) SPNS2.
