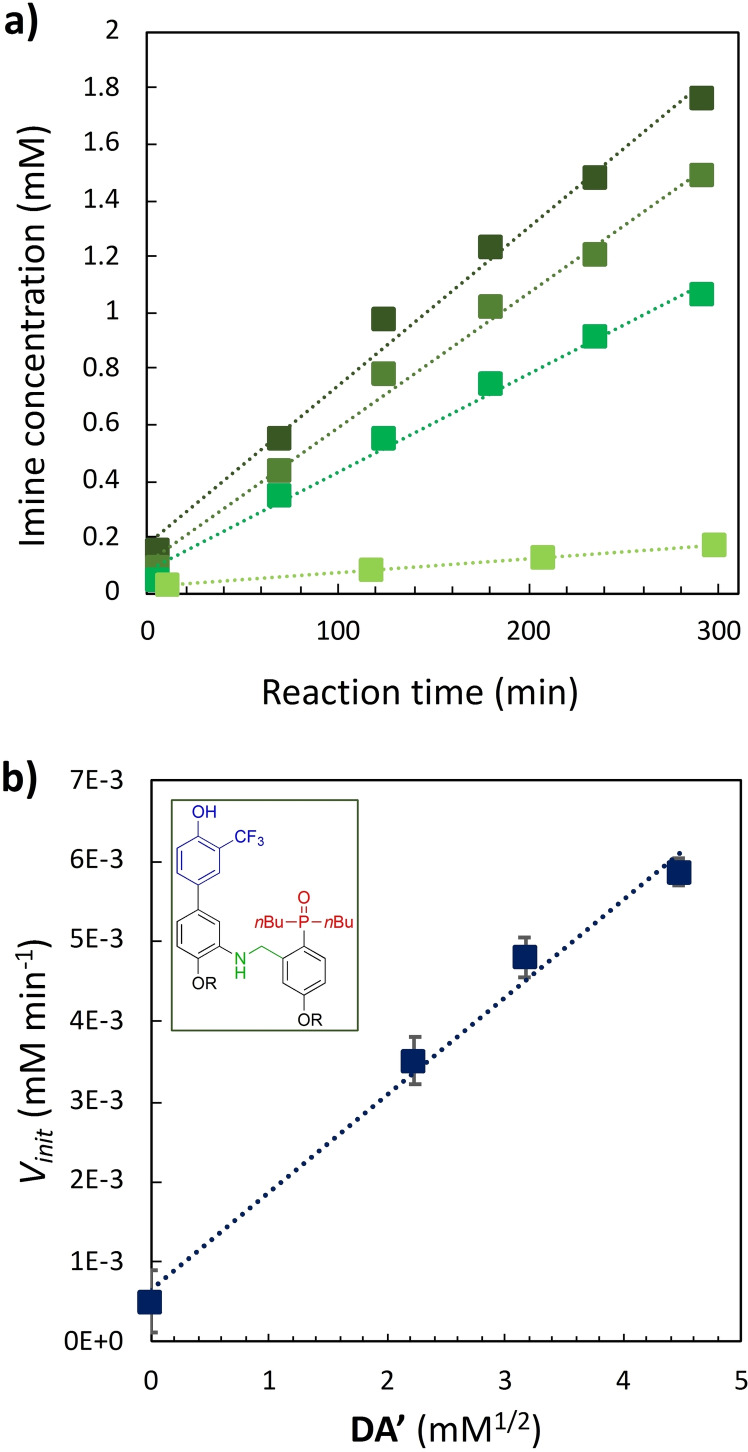
Figure 7.
a) Imine formation in chloroform‐d at 298 K between D and A (50 mM each in a well‐sealed tube) in the presence of aniline template DA’ (0, 5, 10, 20 mM, respectively from light to dark green) Vinit data, as result of the best fit line reported, are summarized in Table S2.1 in the SI. b) The initial reaction rate (V init) of imine formation between D and A (50 mM each) is plotted as a function of the square root of DA’ concentration. The line of best fit shown is Vinit =1.22 ⋅ 10−3 [DA’]1/2+6.46 ⋅ 10−4. According to equation (2) a=1.22 ⋅ 10−3 mM1/2 min−1 and b=6.46 ⋅ 10−4 mM min−1 (respectively 6.19 ⋅ 10−7 M1/2 s−1 and 1.16 ⋅ 10−8 M s−1). The structure of aniline DA’ is shown in the insert.

