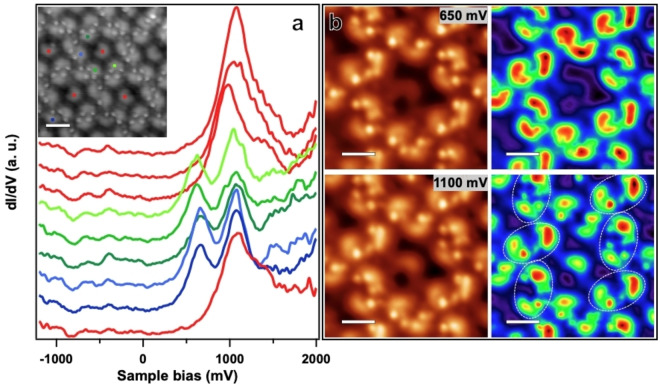
Figure 5.
(a) dI/dV spectra measured on the centres of distinct molecules in the kagomé phase. Monomers are shown in red, dimer molecules featuring two tilted phenyl rings in different shades of green, and dimer molecules featuring one tilted phenyl ring in blue, respectively. The corresponding topography image is shown in the inset (scale bar: 2 nm). (Vb: 2 V, It: 0.13 nA, lock‐in modulation voltage: 100 mV) (b) STM images (left) and the corresponding dI/dV maps measured at constant current (right). The intensity is coloured from red (high) to purple (low). (It: 0.13 nA, lock‐in modulation voltage: 50 mV, scale bar: 1.4 nm)

