
Figure 3.
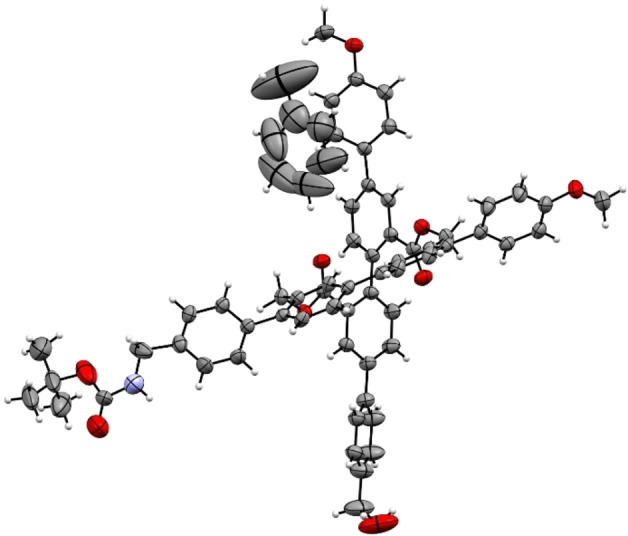
Solid‐state structure of cross (P)‐C1 , plotted as ORTEP plots with 50 % probability. Plotted as single enantiomer for clarity.
Official websites use .gov
A
.gov website belongs to an official
government organization in the United States.
Secure .gov websites use HTTPS
A lock (
) or https:// means you've safely
connected to the .gov website. Share sensitive
information only on official, secure websites.
Solid‐state structure of cross (P)‐C1 , plotted as ORTEP plots with 50 % probability. Plotted as single enantiomer for clarity.