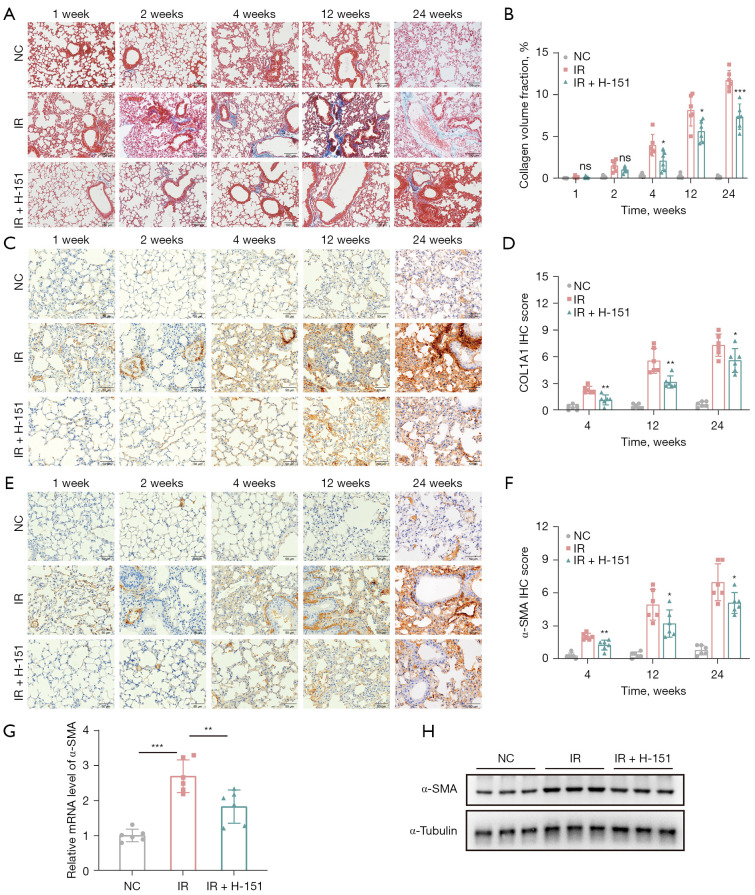
Figure 3.
H-151 ameliorated radiation-induced pulmonary fibrosis in mice. (A) Representative images of Masson staining of lung tissue. Scale bar, 100 µm. (B) Quantitative statistical results of (A). (C) Representative images of immunohistochemical staining of COL1A1. Scale bar, 50 µm. (D) Quantitative statistical results of (C). (E) Representative images of immunohistochemical staining of α-SMA. Scale bar, 50 µm. (F) Quantitative statistical results of (E). (G) Relative mRNA level of α-SMA was detected by RT-qPCR. (H) The protein expression level of α-SMA was detected by western blot. Data are shown as mean ± standard deviation of triplicate measurements; n=6. *, P<0.05; **, P<0.01; ***, P<0.001. NC, negative control; IR, irradiation; IHC, immunohistochemistry; RT-qPCR, reverse transcription quantitative polymerase chain reaction.

