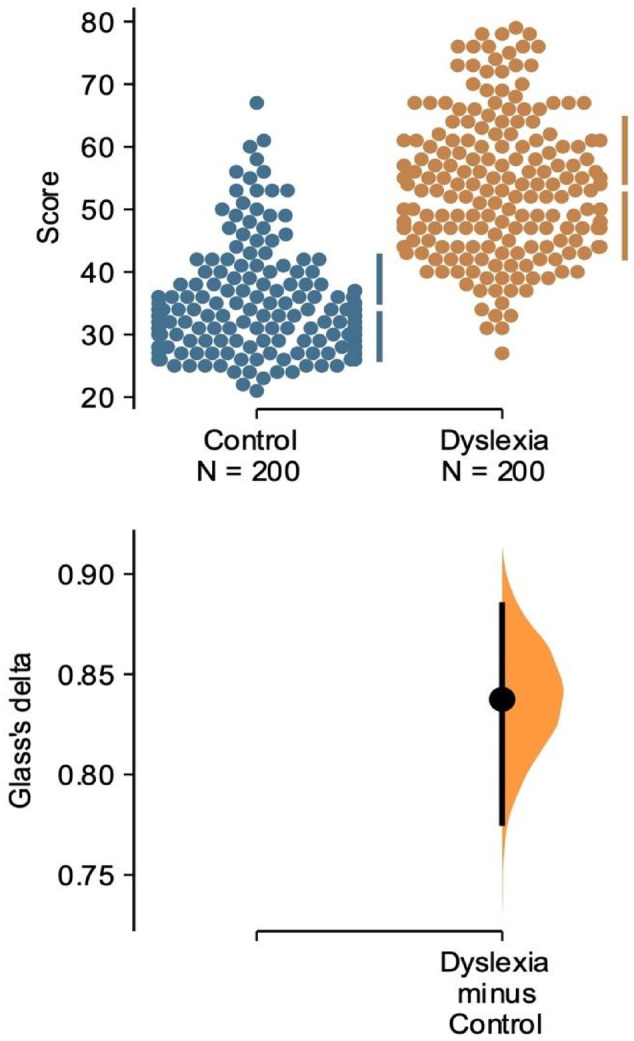
FIGURE 1.

Mean total score on the Dyslexia Adult Checklist between groups. The Glass's delta between Control and Dyslexia is shown in the above Gardner‐Altman estimation plot. Both groups are plotted on the left axes; the mean difference is plotted on a floating axis on the right as a bootstrap sampling distribution. The mean difference is depicted as a dot; the 95% confidence interval is indicated by the ends of the vertical error bar.
