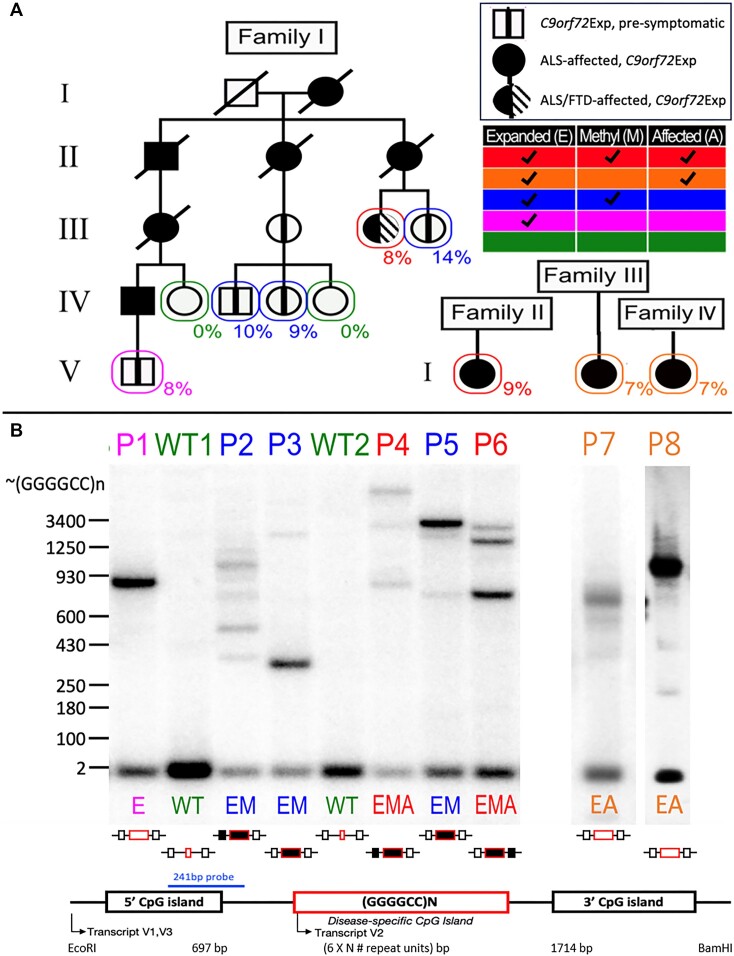
Figure 3.
C9orf72Exp cells, repeat lengths, CpG-methylation and disease state. (A) ALS/FTD families with Southern blot vertically aligned for each individual. Females are represented by circles, males by squares, and disease state is as per the insert legend. Colors of text and boxes around symbols indicate the expansion, methylation and affected status for each sample. Percentages of cells showing FRA9A expression are indicated for each individual in the pedigree. ‘P#’ refers to patient number, ‘E’, ‘M’ and ‘A’ refer to Expanded, Methylated and Affected, is summarized at right, and this coding system is used throughout the text. Southern blot of C9orf72 (GGGGCC)n repeat expansion (‘Materials and methods’ section) used EcoRI/BamHI to release the repeat-containing fragment leaving 697 and 1714 bp upstream and downstream of the (GGGGCC)n/N repeat. (B) Schematic of Southern blot probe location, CpG-methylation status at the GGGGCC repeat and CpG-islands (filled boxes denote methylation). For raw CpG methylation data, see Supplementary Figure S2.

