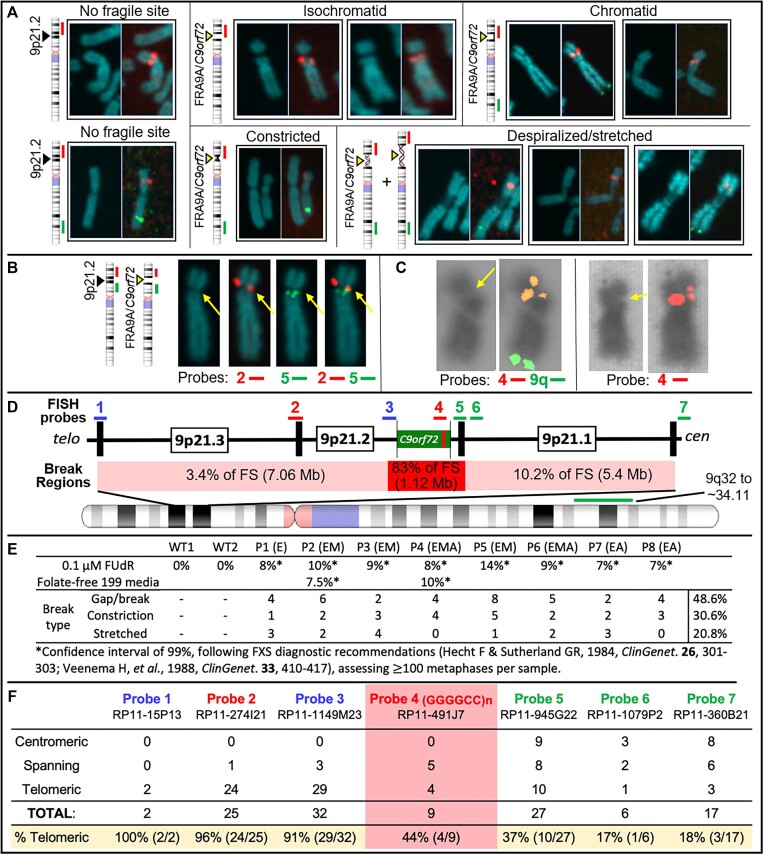
Figure 4.
C9orf72Exp causes FRA9A folate-sensitive fragile site that maps across 9p21. (A) Fragile site forms (indicated), with examples of non-fragile chromosomes from the same metaphase spreads. Showing DAPI-stained and paired FISH-probed chromosomes from FUdR-treated cells. 9q-arm FISH probe (9q32∼34.11; RP11-696J10) in green. FISH probe #2 at C9orf72 (panel D–F) in red. Magnification is the same for all chromosome images within each panel, facilitating comparison within the panel. Control Chr9 in upper left of panel (A) is from the same metaphase as the leftmost isochromatid Chr9. Full metaphase spreads can be provided upon request. Notably, the control ‘No fragile site’ Chr9 in lower left of panel A is from the same metaphase as the leftmost ‘Despiralized/stretched’ Chr9, revealing the lengthening of the stretched Chr9. (B) Representative example of the same chromosome (same magnification) with or without indicated FISH probes. (C) Two representative examples (same magnification) of isochromatids with FISH signal of C9orf72-containing probe 4 split over the fragile site. (D) 9p21 location of FISH probes with regional summary of fragile site location. (E) Quantification of fragility for  100 metaphases under two folate-stressed conditions. (D) Cells were described in Figure 3. (F) Fragile site breakage regions calculated from number of breaks relative to FISH signal found centromeric, telomeric or spanning across probes used. Percentage of telomerically located FISH signal relative to the break is on the bottom row. Frequencies of probes found spanning or on each side of the break were used to calculate the percent breakage within each region in panel (D).

