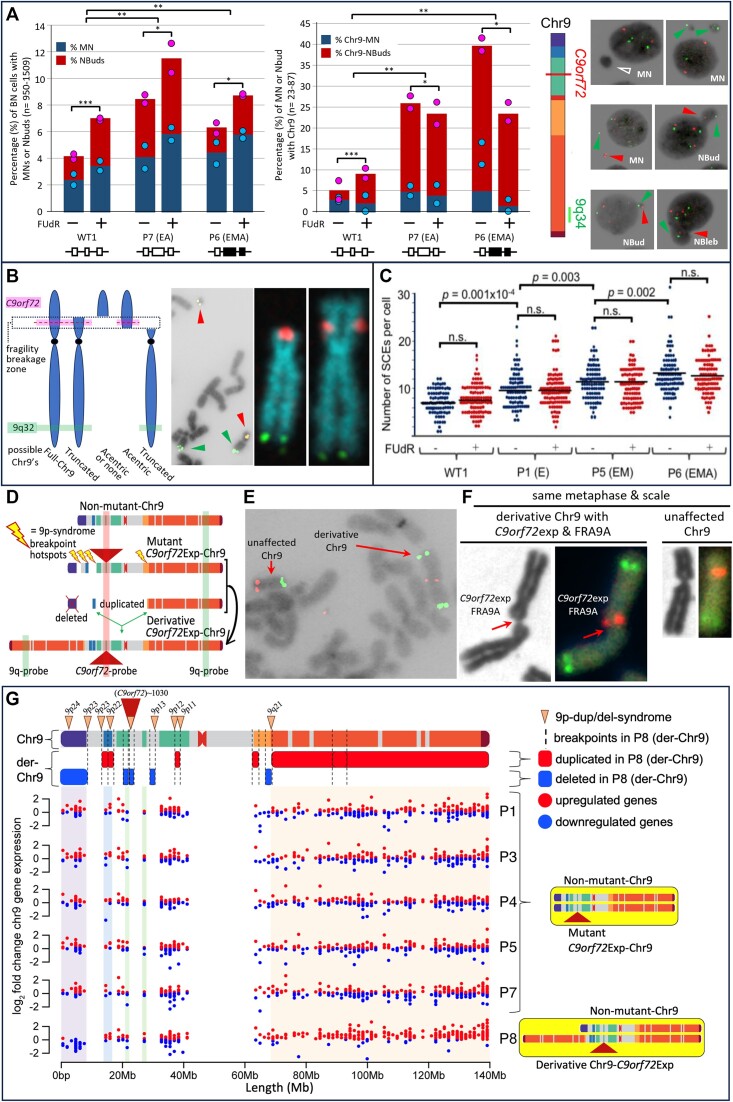
Figure 6.
C9orf72Exp cells display chromosomal instability. (A) Quantification of MN and NBuds in binucleated cells without FISH, left, and with C9orf72 and 9q-FISH probes, middle, in WT and C9orf72Exp cells (P6 (ssc) and P7) containing similar sized repeats (∼770) but differing methylation status. Data are means of two independent experiments. Dots show data of each experiment. Statistical analyses using Fisher’s exact test (*P < 0.05, **P < 0.01, ***P < 0.001). Representative images of MN and NBuds in cytokinesis-blocked cells treated with FUdR for 24 h that contain no FISH signal (hollow arrows), a C9orf72-signal (red arrows) or 9q-signal (green arrows). (B) Depending upon site of breakage, C9orf72-FISH probes can have varying interpretations, left. Example of bona fide chromosome breaks in C9orf72Exp line P4 with acentric terminal C9orf72-containing fragment in same metaphase spread as a truncated-Chr9 that is free of C9orf72-signal, middle. Example of truncated-Chr9 with C9orf72-signal, and control Chr9 from same spread, right. (C) Levels of global SCEs in WT and C9orf72Exp cells ± FUdR. Methylation/clinical status is as per Figure 3. Each datapoint represents a single metaphase. At least 100 mitotic cells were analyzed per condition in each experiment. Statistical analyses were performed by Student’s t-test (P < 0.01). NS: not significant. See also Supplementary Figure S6B and D. (D) C9orf7Exp line P8 with complex highly rearranged derivative-Chr9, schematic, see text and Supplementary Figure S7A. (E) Example of FRA9A-expressing derivative-Chr9 and control Chr9 in same spread with C9orf72- (red) and 9q-FISH probes (green) (100% = 100/100 metaphases). (F) Only the derivative-Chr9 expresses FRA9A coincident with the C9orf72-FISH signal, revealing derivative-Chr9 to be the C9orf72Exp-Chr9, (+FUdR, 7% = 7/100, 99% confidence). (G) Breakpoint analysis (top) and gene expression (binned/gene) along Chr9 in each of the C9orf72 Exp cells with trisomic (red dots) and monosomic (blue dots) in duplicated and deleted regions of the derivative-Chr9 (P8). Breakpoint and copy number change analysis in P8 was by whole genome sequencing, see Supplementary Table S3. An interactive html file detailing mis-expressed genes can be accessed here https://data.cyverse.org/dav-anon/iplant/home/ljsznajder/FRA9A/Chromosome9.html), also presented in Supplementary Table S4. See Supplementary Figure S7B–D for statistical significance of differential gene expression.

