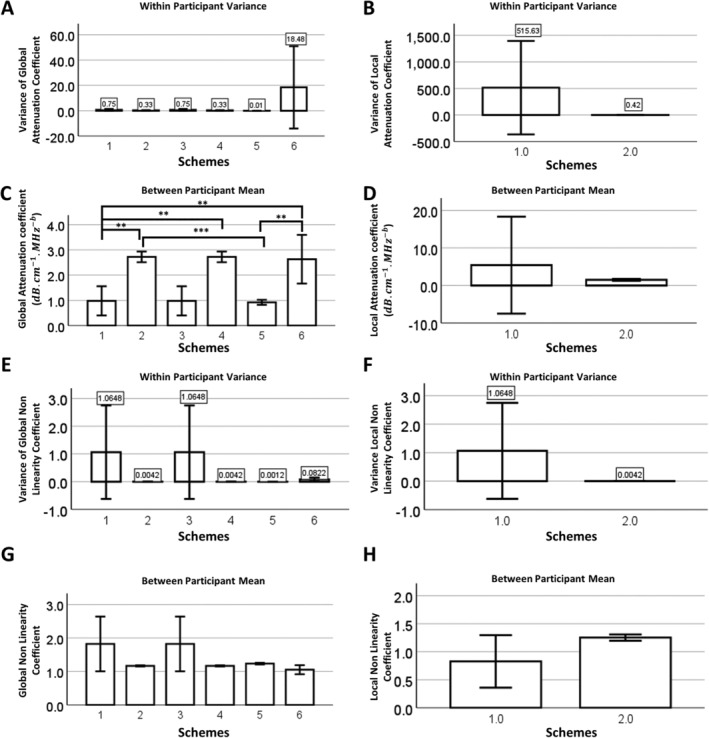
Figure 3.

Attenuation coefficient assessments from different analytical schemes. Variance of the (A) global attenuation coefficient and (B) local attenuation coefficients for each analytical scheme. Local attenuation coefficients were only applied to schemes 1 and 2. Mean (C) global attenuation coefficients and (D) local attenuation coefficients for each analytical scheme. Variance of (E) global nonlinearity coefficient and (F) local nonlinearity coefficient for each analytical scheme. Mean (G) global nonlinearity coefficient and (H) local nonlinearity coefficients for each analytical scheme. Significance between individual groups based on Tukey's multiple comparison test (*, <.05; **, <.01; ***, <.001).
