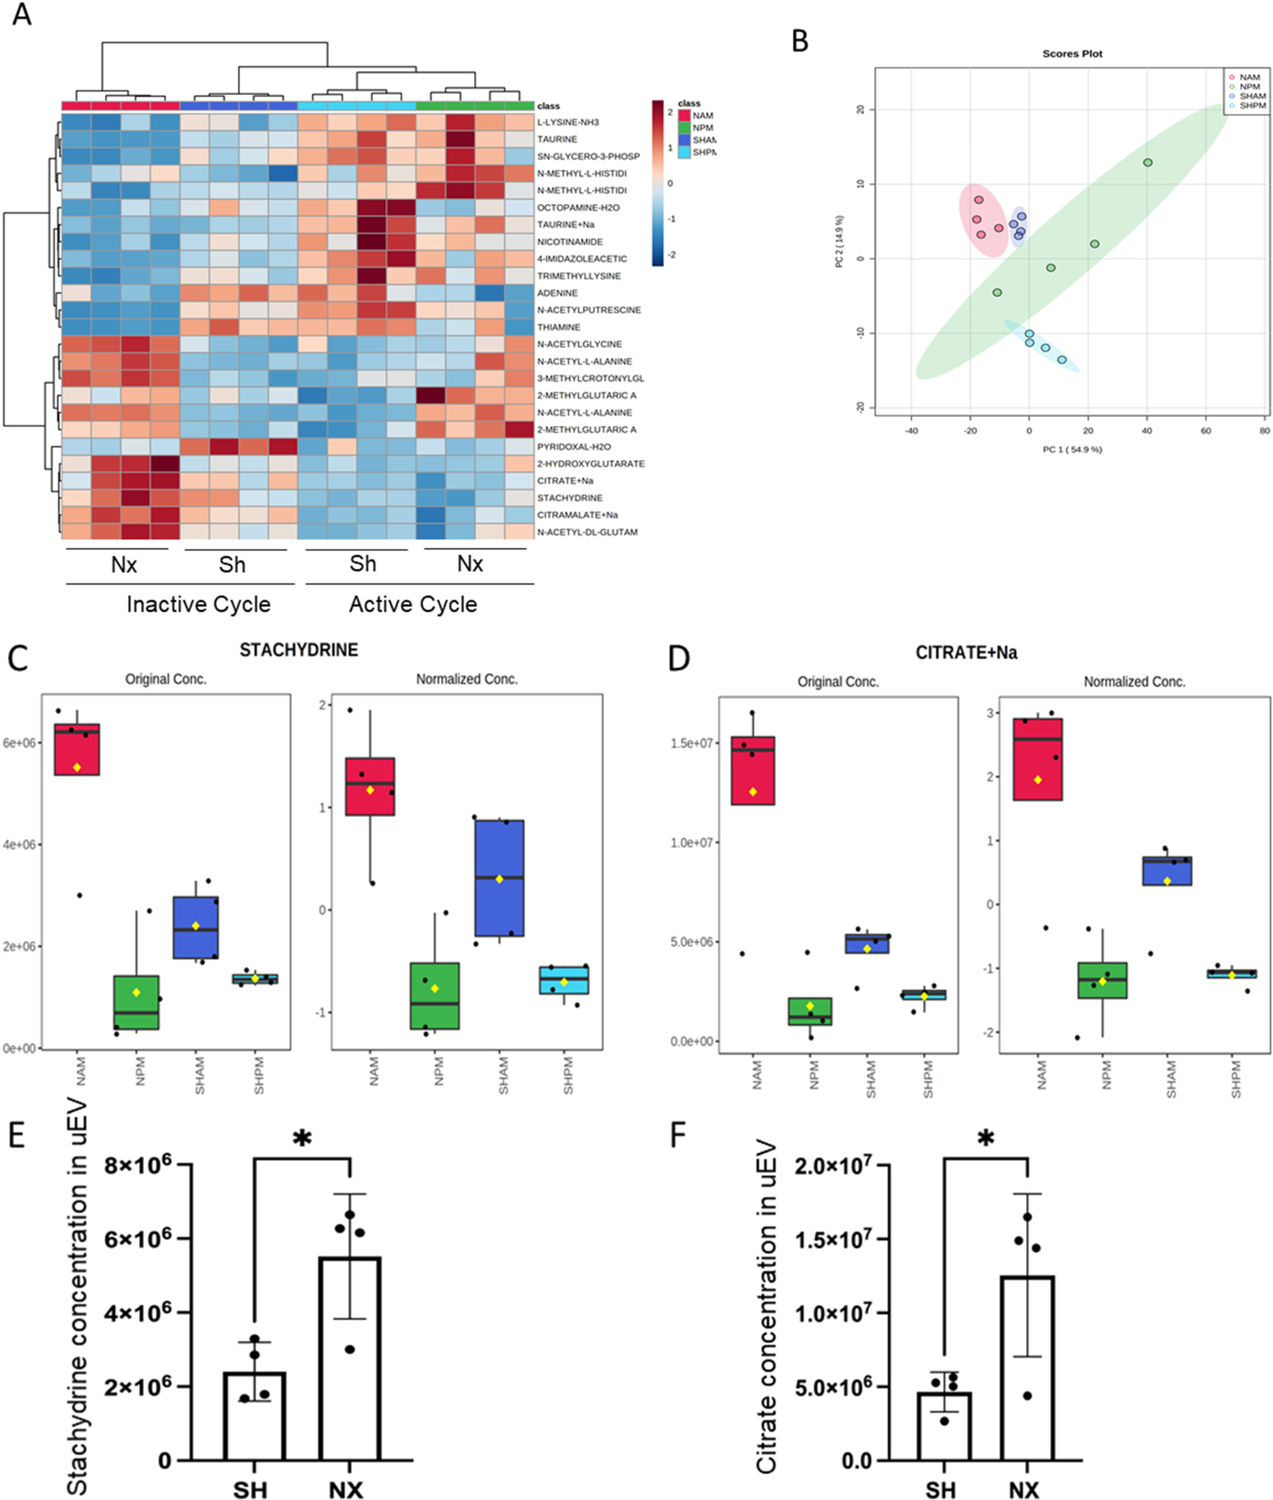
Fig. 10.

Metabolomic Analysis of uEV cargo. A. Heatmap with top 25 metabolites showing clustering of the metabolites based on relative concentration of the metabolites. Data was normalized to the median with Pareto scaling. B. Principal component analysis (PCA). C. Summary Plot of stachydrine enrichment in EVs isolated from urine samples of nephrectomized mice collected during the inactive cycle (NAM) or active cycle (NPM) and sham mice collected during the inactive cycle (SHAM) or active cycle (SHPM). D. Summary of sodium citrate enrichment in EVs isolated from urine samples of nephrectomized mice collected during the inactive cycle (NAM) or active cycle (NPM) and sham mice collected during the inactive cycle (SHAM) or active cycle (SHPM); E. plot of stachydrine concentration in uEVs from sham and nephrectomized mice; F. plot of citrate concentration in uEVs from sham and nephrectomized mice.
