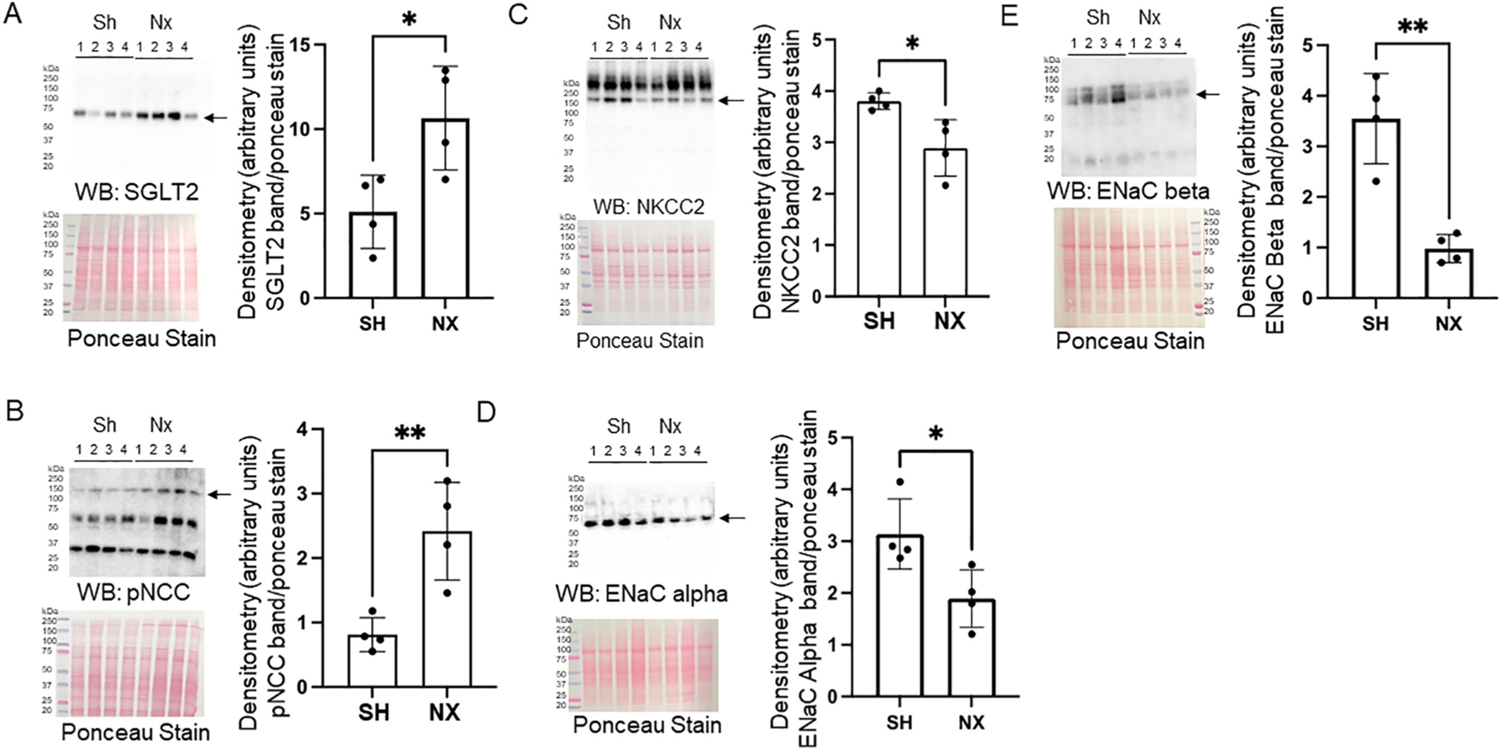
Fig. 6.

Western blot and densitometric analysis of renal transporters and ion channels in the native kidney of nephrectomized and sham control mice. A. Western blot of SGLT2 (top) and densitometric analysis of the immunoreactive band normalized to the Ponceau stain (bottom). B. Western blot of phospho-NCC (pNCC) (top) and densitometric analysis of the immunoreactive band normalized to the Ponceau stain (bottom). C. Western blot of NKCC2 (top) and densitometric analysis of the immunoreactive band normalized to the Ponceau stain (bottom). D. Western blot of ENaC alpha subunit (top) and densitometric analysis of the immunoreactive band normalized to the Ponceau stain (bottom). E. Western blot of ENaC beta subunit (top) and densitometric analysis of the immunoreactive band normalized to the Ponceau stain (bottom).
