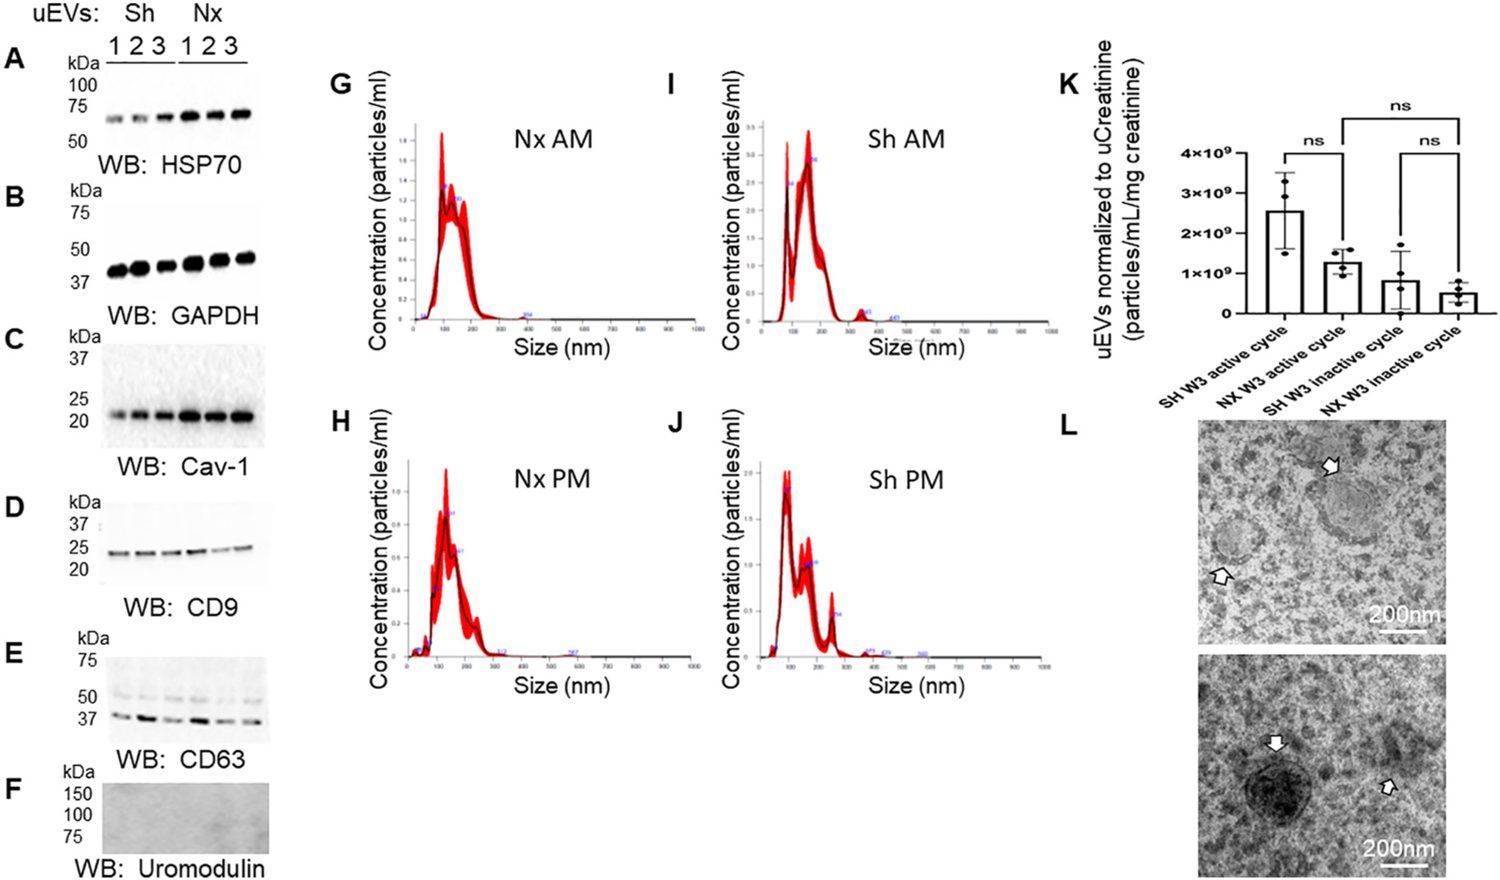
Fig. 9.

Western blot analysis of urinary extracellular vesicle (uEV) markers. A. HSP70 protein enrichment in uEVs from sham (Sh) and nephrectomized (Nx) mice; B. GAPDH protein enrichment in uEVs from sham (Sh) and nephrectomized (Nx) mice; C. Caveolin-1 (Cav-1) protein enrichment in uEVs from sham (Sh) and nehrectomized (Nx) mice; D. CD9 protein enrichment in uEVs from sham (Sh) and nehrectomized (Nx) mice; E. CD63 protein enrichment in uEVs from sham (Sh) and nehrectomized (Nx) mice; F. absence of uromodulin protein enrichment in uEVs from sham (Sh) and nehrectomized (Nx) mice; G. Representative nanoparticle tracking analysis graph showing concentration and size of uEVs isolated from urine collected from nephrectomized mice during the inactive cycle; H. Representative nanoparticle tracking analysis graph showing concentration and size of uEVs isolated from urine collected from nephrectomized mice during the active cycle; I. Representative nanoparticle tracking analysis graph showing concentration and size of uEVs isolated from urine collected from sham mice during the inactive cycle; J. Representative nanoparticle tracking analysis graph showing concentration and size of uEVs isolated from urine collected from sham mice during the active cycle; K. Plot of uEV concentration from sham and unilateral nephrectomized mice 3 weeks (W3) after the surgical procedure and after normalization to urinary creatinine; L. Representative transmission electron micrographs showing uEVs (white arrows) from sham (Sh) and nephrectomized (Nx) mice (N = 3 per group).
