. 2024 Dec 3. Online ahead of print. doi: 10.1039/d4sc06246a

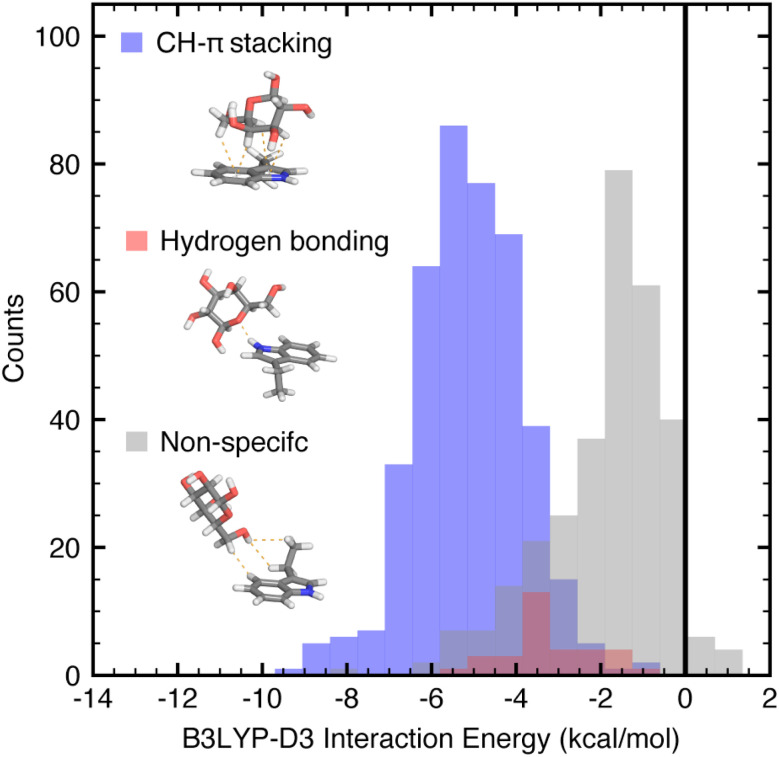
Fig. 2. Unnormalized distributions of B3LYP-D3 DFT interaction energies for the three categories of galactose–aromatic amino acid close contacts shown as translucent histograms with bin width 0.65 kcal mol−1: CH–π stacking interactions (blue), hydrogen bonding interactions (red), and other, non-specific contacts (gray), of the full dataset. Interaction energies were evaluated using the aug-cc-pVDZ basis set and implicit solvent corrections were computed using the conductor-like polarizable continuum model (C-PCM) and reported in kcal mol−1. Atoms are colored as follows: carbon in gray, oxygen in red, hydrogen in white, and nitrogen in blue.

Fig. 2