. 2024 Dec 3. Online ahead of print. doi: 10.1039/d4sc06246a

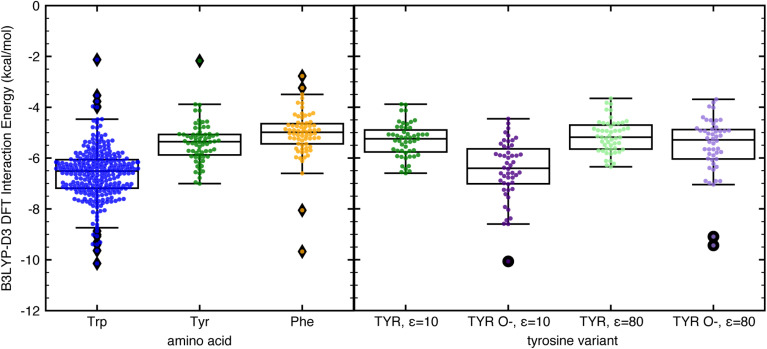
Fig. 4. Box and whisker plot comparisons with all data points shown of B3LYP-D3 DFT interaction energies computed with C-PCM implicit solvent corrections of (left) CH–π stacking interactions formed with tryptophan (blue), tyrosine (green), and phenylalanine (light orange); and (right) CH–π stacking interactions formed with tyrosine with ε = 10 (green), deprotonated tyrosine in its phenoxide form with ε = 10 (purple), tyrosine with ε = 80 (light green), and phenoxide with ε = 80 (light purple). Each box is bounded by the upper and lower quartiles of the dataset and split by the median. The whiskers extend up to 1.5 times the interquartile range on either side of the box. All points that lie outside that range are defined as outliers and shown as filled diamonds on the left plot and filled circles on the right plot. The IEs were evaluated using the aug-cc-pVDZ basis set and are reported in kcal mol−1.

Fig. 4