. 2024 Dec 3. Online ahead of print. doi: 10.1039/d4sc06246a

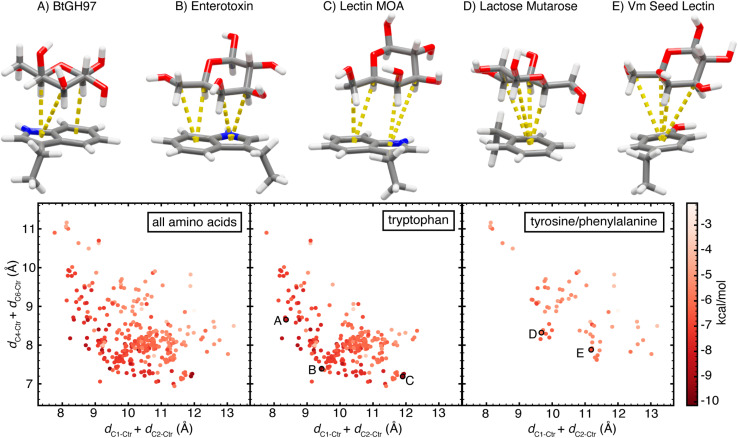
Fig. 8. Scatterplots of the orientations of CH–π stacking interactions formed by (left) all three aromatic amino acids, (center) only tryptophan, or (right) only tyrosine and phenylalanine. Each data point is plotted according to dC1–Ctr + dC2–Ctrversus dC4–Ctr + dC6–Ctr and colored by the B3LYP-D3 DFT interaction energy computed using the aug-cc-pVDZ basis set reported in kcal mol−1, according to the color scale shown at the far right. Five data points (A–E) are highlighted on the plots and the corresponding CH–π stacking interactions are shown. Atoms are colored as follows: carbon atoms in gray, oxygen atoms in red, nitrogen atoms in blue, and hydrogen atoms in white. Each component CH–π interaction with dCn–Ctr < 4.6 Å and θProj–Cn–Ctr < 50° is visualized by a dotted yellow line between the interacting carbon atom and the nearest aromatic ring centroid.

Fig. 8