. 2024 Dec 3. Online ahead of print. doi: 10.1039/d4sc06246a

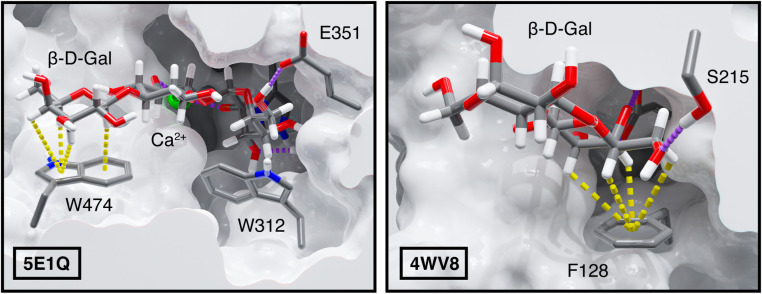
Fig. 9. Protein-carbohydrate interactions of (left) Bacteroides thetaiotaomicron glycoside hydrolase and (right) Vatairea macrocarpa seed lectin with their carbohydrate ligands. CH–π interactions are shown as yellow dashed lines, and calcium ion coordinating and hydrogen bonding interactions are shown as purple dashed lines. The surface of the protein structure is shown in light gray. Atoms are colored as follows: carbon in gray, oxygen in red, hydrogen in white, nitrogen in blue, and calcium in green. Component CH–π interactions with dCn–Ctr < 4.6 Å and θProj–Cn–Ctr < 50° are visualized as dotted yellow lines between the interacting hydrogen atom and nearest aromatic ring centroid.

Fig. 9