Fig. 2.

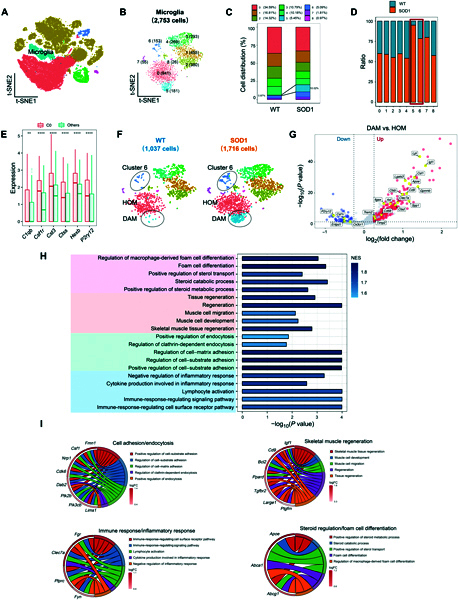
Disease-associated microglia (DAM) show a dramatic increase in SOD1G93A mice. (A) t-SNE plot highlights the microglia in color blue. (B) t-SNE plot showing 9 subclusters of microglia population with “resolution = 0.8”. (C) Stacked bar graph showing the average percentages of cells in each cluster of microglia in WT and SOD1G93A mice. (D) Comparison of the proportions of microglia subpopulations in WT and SOD1G93A mice. The number of cells in the C5 and C6 of the SOD1G93A group is higher than that in the WT group, especially in cluster 5. (E) Bar plots showing the expression level of 6 homeostatic microglia (HOM) markers in C0 compared to those in all other microglia subclusters. **P value < 0.01, ****P value < 0.0001, C0 vs. others. (F) t-SNE plot showing subcluster annotations of microglia. The numbers of microglia in WT and SOD1G93A are in parentheses. (G) Volcano plot showing the DEGs between DAM and HOM. Blue dots represent down-regulated DEGs, and red dots represent up-regulated DEGs. Genes related to DAM and HOM signature are labeled yellow. (H) GO enrichment analysis was performed by GSEA on genes ranked by log2FC between DAM and HOM. Bar plot showing 4 major pathway categories: “steroid regulation/foam cell differentiation” colored pink, “skeletal muscle regeneration” colored orange, “cell adhesion/endocytosis” colored green, and “immune/inflammatory response” colored blue. (I) The relationships between the activated GO terms in (H) and the core genes are depicted. Circos plots showing the core genes related to “cell adhesion/endocytosis”, “immune/inflammatory response”, “skeletal muscle regeneration”, and “steroid regulation/foam cell differentiation” functions. FC, fold change.
