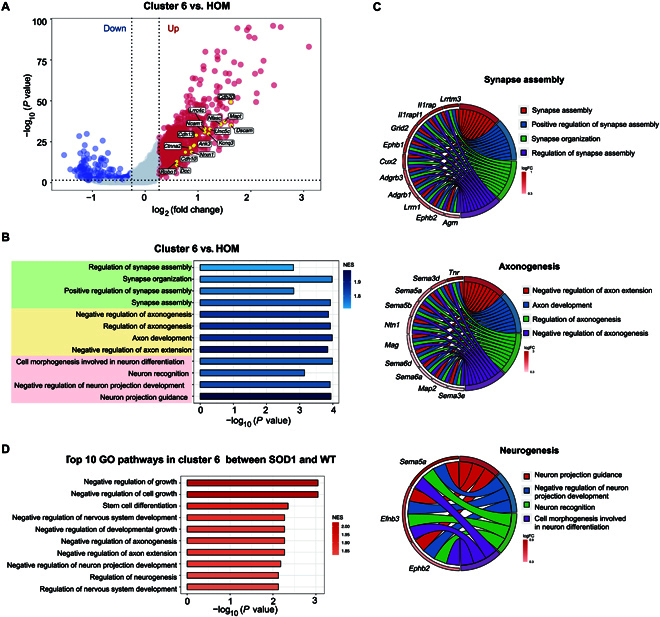
Fig. 3.

Cluster 6 microglia show a dramatic increase in SOD1G93A mice. (A) Volcano plot showing the DEGs between cluster 6 microglia and HOM. Blue dots represent down-regulated DEGs, and red dots represent up-regulated DEGs. (B) GO enrichment analysis was performed on genes ranked by log2FC between cluster 6 microglia and HOM. Bar plot showing 3 major pathway categories: “synapse assembly”, “axonogenesis”, and “neurogenesis”. (C) The relationship between the activated GO terms in (B) and the involved genes is depicted. Circos plots show the core genes related to the pathways. (D) Bar plot displaying the top 10 GO enrichment pathways in cluster 6 between SOD1G93A mice and WT mice.
