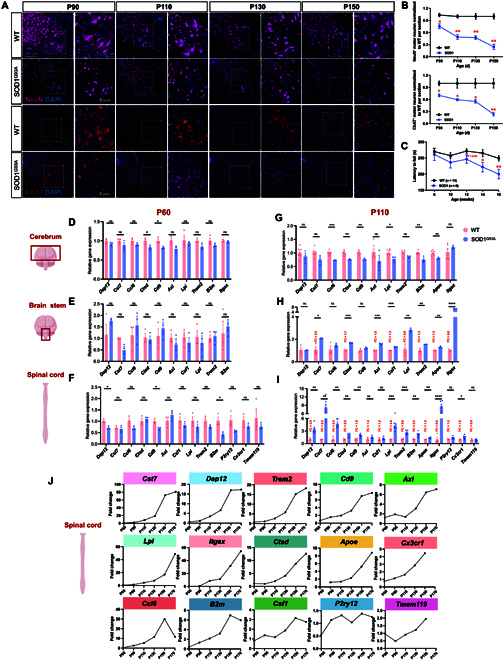
Fig. 5.

DAM appear in the spinal cord and brain stem after motor neuron death in SOD1G93A mice. (A and B) Representative microscopic images and quantification of NeuN+ and ChAT+ motor neurons at the ventral horn of the lumbar spinal cord in SOD1G93A and WT mice at different time points stained for NeuN. Nuclei are labeled with 4′,6-diamidino-2-phenylindole (DAPI). Scale bar: 20 μm. (C) Weekly rotarod performances of WT (n = 14) and SOD1 (n = 6) mice. Mean holding times on the rotating rod at indicated weeks were plotted. *P < 0.05 and **P < 0.01, Student t tests. Data are mean ± standard error of the mean (SEM). (D to I) Quantitative reverse transcription quantitative polymerase chain reaction (RT-qPCR) analysis of DAM signatures in the cerebrum, brain stem, and spinal cord at P60 and P110. Each result was normalized to Gapdh. Error bars denote SEM (n = 3 to 6). *P < 0.05, **P < 0.01, ***P < 0.001, and ****P < 0.0001, Student t tests. (J) A line chart showing the average fold change of the temporal evolution of each DAM marker. NeuN, neuronal nuclei; ChAT, choline acetyltransferase; ns, not significant.
