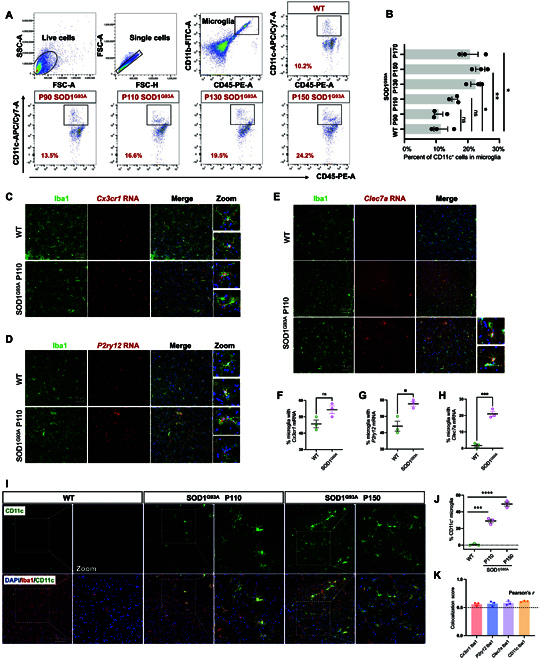
Fig. 6.

DAM exhibit an increase during disease progression in SOD1G93A. (A) Flow cytometry analysis of CD11c+CD11b+CD45+ DAM in the spinal cord (per 104 total microglia) at 90, 110, 130, 150, and 170 d in SOD1G93A and WT mice. (B) Statistics of the percent of CD11c+ DAM at different time points. *P < 0.05 and **P < 0.01, Student t tests. (C to E) Fresh-frozen spinal cords from 110-d WT and SOD1G93A littermates were sectioned and prepared using RNAscope with the probes (Cx3cr1, P2ry12, and Clec7a). Scale bar: 75 μm. (F to H) Quantification of (C to E) the percent of messenger RNA (mRNA)-probe-positive microglia analyzed per image. n = 3 animals per group; n = 3 to 4 images from the ventral horn (1 image per section). *P < 0.05; ***P < 0.001; ns, not significant; Student t tests. Data are represented as mean ± SEM. (I) Representative images from the lumbar spinal cord in SOD1G93A mice and their littermates at 110 and 150 d, stained for a DAM marker gene (CD11c, green), ionized calcium-binding adapter molecule 1 (Iba1; microglia, red), and DAPI (cell nuclei, blue). Scale bar: 100 μm. (J) Quantification of percent of CD11c+ microglia analyzed per image. n = 3 animals per group; n = 3 to 4 images from ventral horn (1 image per section). ***P < 0.001, ****P < 0.0001, Student t tests. (K) Colocalization analysis of mRNA (Cx3cr1, P2ry12, and Clec7a) and protein (CD11c) with microglia (Iba1) using Pearson’s correlation coefficient (Pearson’s r). A Pearson’s r above 0.5 typically indicates a significant level of colocalization. SSC-A, side scatter area; FSC-A, forward scatter area; FSC-H, forward scatter height; PE-A, phycoerythrin-A; APC, allophycocyanin; Cy7-A, cyanine 7-A.
