

ABSTRACT
Objective
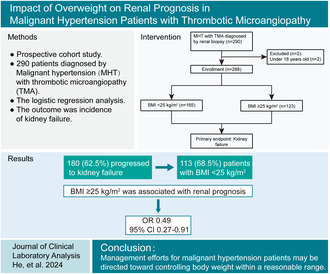
Overweight and obesity is a risk factor for hypertension. Malignant hypertension (MHT) is the most severe form of hypertension, and thrombotic microangiopathy (TMA), one of its complications, has been linked to significant renal outcomes. However, the impact of overweight and obesity on renal prognosis in MHT patients with TMA is not well understood.
Methods
This was a prospective cohort enrolled 288 MHT patients with renal TMA from 2008 to 2023. The clinical and histopathological characteristics were recorded based on body mass index (BMI, < 25 and ≥ 25 kg/m2). The outcome was the incidence of kidney failure. The associations of BMI with kidney failure were examined in logistic regression models.
Results
Among 288 patients, 180 (62.5%) progressed to kidney failure, including 113 (68.5%) patients with BMI < 25 kg/m2. Participants with obesity had higher levels of hemoglobin, estimated glomerular filtration rate and C3, but lower levels of serum creatinine and IgA nephropathy. BMI ≥ 25 kg/m2 was associated with a better outcome of kidney failure in MHT patients with TMA (odd ratios [ORs]: 0.49 [95% confidence interval (CI): 0.27–0.91], p = 0.025). Male, uric acid, onion skin lesions, and global sclerosis ratio were correlated with higher risk of kidney failure; serum albumin and treatment with renin–angiotensin system blockers were related to lower risk of kidney failure.
Conclusions
In MHT patients with renal TMA, normal‐weight rather than overweight was found to associate with a worse renal prognosis. Management efforts for MHT may be directed toward controlling body weight within a reasonable range for patients.
Keywords: kidney failure, malignant hypertension, overweight and obesity, renal biopsy, thrombotic microangiopathy
The present study first reveals the association of overweight and obesity and renal outcome for kidney failure in MHT patients with renal TMA. We have identified that normal weight, rather than overweight or obesity, contributes to a worse renal outcome of kidney failure in MHT patients with renal TMA. The study proposes that management efforts for MHT may be directed toward controlling body weight within a reasonable range for patients.
1. Introduction
Malignant hypertension (MHT) is the most severe form of hypertension characterized by very high blood pressure (BP) accompanied by bilateral hemorrhages and/or exudates with or without papillary edema in the funduscopic examination [1]. Although mortality has decreased in recent decades after the introduction of antihypertensive drugs, acute organ damage (retinopathy, renal failure, or left ventricular dysfunction) and chronic sequelae are common [2, 3]. Renal thrombotic microangiopathy (TMA), one of the complications of MHT, is characterized by diffuse capillary loop wrinkling and capsule thickening, marked renal artery intimal thickening, vessel wall thickening with an “onion‐peel” appearance, fibrinoid necrosis and intravascular thrombosis et al. [4]. This can lead to end‐organ ischemia and infarction affecting particularly the kidney and brain [5]. It is believed to arise from mechanical shear stress to the renal microcirculation in MHT. In addition, the prevalence of TMA in MHT ranges from 14% to 46%, and its occurrence has been associated with significant mortality and morbidity, including end‐stage renal disease (ESRD) [6, 7].
Overweight and obesity, defined by an elevated body mass index (BMI), is considered a cardiovascular risk factor, including hypertension, in the general population. Additionally, it is also associated with an increased risk of incident chronic kidney disease (CKD) and ESRD [8]. Epidemiological studies indicate that at least 72% of patients with ESRD have hypertension and/or diabetes, both of which are driven largely by obesity [9]. Although hypertension has a detrimental impact on cardiovascular and kidney outcomes in obesity, opposite results have also been reported in hypertension and CKD [10]. A recent retrospective study of the association between obesity and MHT found that BMI was not an independent predictor of adverse outcomes for death or dialysis in MHT patients [11]. However, further investigation is needed to determine the impact of overweight or obesity on renal outcomes in MHT patients with renal TMA.
The aims of the present study are to report the renal outcome in a cohort of 290 MHT patients with renal TMA in different BMI groups. A long‐term follow‐up was conducted, and clinical and histological characteristics were identified according to BMI. In addition, we analyzed the kidney outcome under different stratified factors such as age, sex, and intensive BP lowering.
2. Methods
2.1. Study Design and Population
This study enrolled 290 patients diagnosed with biopsy‐proven MHT‐associated renal TMA upon admission to the First Affiliated Hospital of Sun Yat‐sen University between 2008 and 2023. Patients under the age of 18 were excluded, leaving 288 participants with available BMI data and without overhydration. Due to the limited number of patients undergoing overweight and obesity in this study, the participants were divided into two groups by BMI according to the World Health Organization (WHO) guidelines: the lean group (BMI < 25 kg/m2) and the overweight group (BMI ≥ 25 kg/m2), which included individuals with overweight or obesity [12]. The study was conducted in accordance with the Declaration of Helsinki. Ethics committee approval was provided at the First Affiliated Hospital of Sun Yat‐sen University. All patients provided written informed consent.
2.2. Data Collection and Renal Histopathology
The baseline and follow‐up data were collected from medical records in the hospital following a uniform protocol. The following demographic and clinical characteristics were extracted: age, sex, smoking, drinking, and BP at admission and discharge. The following laboratory data were also collected: hemoglobin, platelet count, serum albumin, lipid index, blood urea nitrogen, serum creatinine, urea acid, estimated glomerular filtration rate (eGFR), C3, C4, and proteinuria. In addition, medical treatment data were obtained, including the use of calcium channel blockers (CCBs), angiotensin‐converting enzyme inhibitors (ACEIs), angiotensin receptor blockers (ARBs), sacubitril/valsartan, α‐blockers, β‐blockers, sulodexide soft capsules, statins, and beraprost sodium.
The primary outcome was the incidence of kidney failure. Follow‐up was the interval between the MHT diagnosis and the last outpatient visit. The outcome data were extracted from the medical records at First Affiliated Hospital of Sun Yat‐sen University.
Percutaneous kidney biopsy specimens were processed following standard protocols. The renal biopsies were examined by light microscopy and electron microscopy. All biopsy slides were re‐reviewed by two senior pathologists without knowledge of clinical outcomes. Data of the following light microscopic parameters were collected: including the diagnosis of immunoglobulin A nephropathy (IgAN), global sclerosis, and segmental sclerosis. Meanwhile, tubulointerstitial parameters included tubular atrophy/interstitial fibrosis (IFTA) and tubular epithelial cell exfoliation. Vascular parameters, including vascular hyalinosis, fibrinoid necrosis, onion skin lesions, intravascular thrombosis, and intravascular red blood cell (RBC) fragments arterial, were also noted. Electron microscopy assessment included the presence of subendothelial deposits and the degree of endothelial cell swelling.
2.3. Definition
The diagnosis of MHT was based on the detection of a sharp and sudden increase in BP (particularly diastolic BP > 130 mmHg), often accompanied by hypertensive retinopathy grade 3 or 4 of Keith–Wagener–Barker classification (bilateral retinal flame‐shaped hemorrhages and/or exudates or cotton wool spots with or without papilledema) and frequently with progressive target organ dysfunction [13, 14]. Renal TMA was diagnosed by a nephrologist and two pathologists based on renal pathological features. The individuals with renal TMA caused by hemolytic uremic syndrome, thrombotic thrombocytopenic purpura, pregnancy, tumor, drug toxicity, and renal transplantation were excluded. Obesity was defined according to the WHO guidelines [12]. The eGFR was calculated using the Chronic Kidney Disease Epidemiology Collaboration equation [15]. Mean arterial pressure (MAP) was calculated as one‐third of systolic blood pressure (SBP) plus two‐thirds of diastolic blood pressure (DBP). Intensive BP lowering was SBP < 130 mmHg at discharge [16, 17]. Kidney failure was defined as an eGFR < 15 mL/min/1.73 m2 and a need for chronic dialysis or kidney transplantation [6].
2.4. Statistical Analysis
All categorical data are presented as numbers and percentages, while statistics for continuous variables are presented as median with interquartile range (IQR). Two‐sample comparisons were performed using either the Student's t‐test or Mann–Whitney U test for continuous variables, and the chi‐squared test or nonparametric Fisher's exact test for categorical variables, as appropriate. We used quantile regression to evaluate the reference values of BMI measurements in the study population. Reference values for BMI were presented as the fifth, 50th, and 95th percentiles according to age, using separate values for male and female.
Logistic regression was conducted including the risk factors that we focused on for the primary outcome of kidney failure. The risk factors that met the 0.20 significance threshold in univariable analysis or defined as relevant in the literature even if not significant in our univariable analysis were included for further multivariable analysis. The results were given as odd ratios (ORs) and 95% confidence intervals (CIs). Moreover, the interactions and stratification analysis between BMI and several factors were tested in the model. The analysis included median age group (≤ 35 and > 35 years), gender, proteinuria, the presence of IgAN, global sclerosis ratio, and IFTA. p‐values < 0.05 were considered statistically significant. All the statistical analyses were carried out with SPSS version 25.0 (IBM Co., Armonk, NY, USA) and R version 4.3.1 (R Foundation for Statistical Computing, Vienna, Austria).
3. Results
3.1. Baseline Characteristics of the Study Population
Among 288 MHT patients with renal TMA, 165 (57.29%) patients in the lean group (BMI < 25 kg/m2) and 123 (42.71%) in the overweight group (BMI ≥ 25 kg/m2) were analyzed in this study (Figure 1). As shown in Table 1, patients with BMI ≥ 25 kg/m2 exhibited a higher BMI than those with BMI < 25 kg/m2 (median 27.4 kg/m2 vs. 22.5 kg/m2, p < 0.001). Additionally, there was a higher proportion of men in the overweight group compared to the lean group (95.1% vs. 84.2%, p = 0.004). The median SBP and DBP on admission were 159 mmHg (IQR 138–181) and 100 mmHg (IQR 86–114), respectively, with no differences between groups. In laboratory examinations, the group with overweight or obesity exhibited higher levels of hemoglobin (median 113 g/L vs. 99 g/L, p < 0.001) and serum albumin (median 38.5 g/L vs. 36.0 g/L, p < 0.001) in comparison to the lean patients. Furthermore, kidney function parameters, including serum creatinine, urea nitrogen, and eGFR, were significantly worse in the lean patients than in those with overweight or obesity. In terms of medical treatment, there was no difference in the frequency of antihypertensive medication usage among patients with MHT across two groups. Nevertheless, the group with overweight or obesity had a higher percentage of statin treatment as expected (52.8% vs. 40.0%, p = 0.030).
FIGURE 1.
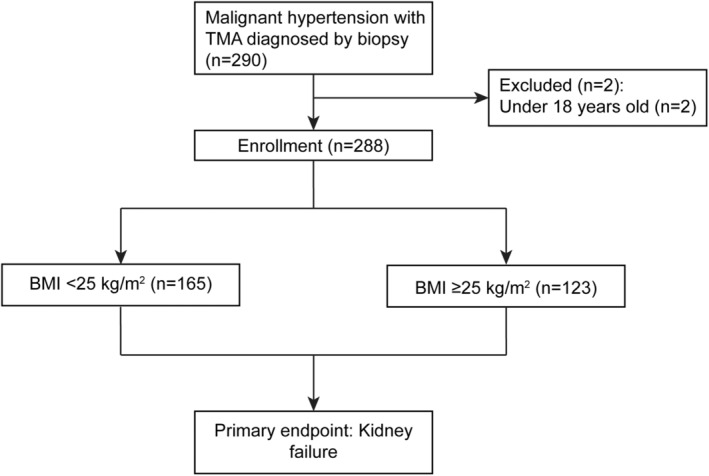
Study flow.
TABLE 1.
Baseline characteristics in different groups.
| Characteristics | Total (n = 288) | BMI | p | |
|---|---|---|---|---|
| < 25 (n = 165) | ≥ 25 (n = 123) | |||
| Demographics | ||||
| Age, year | 35 (30, 41) | 35 (30, 41) | 35 (30, 40) | 0.997 |
| Sex, male, n (%) | 256 (88.9) | 139 (84.2) | 117 (95.1) | 0.004 |
| BMI | 24.1 (22.1, 27.0) | 22.5 (21.0, 23.6) | 27.4 (26.2, 29.3) | < 0.001 |
| Smoking, n (%) | 129 (44.8) | 69 (41.8) | 60 (48.8) | 0.240 |
| Drinking, n (%) | 84 (29.2) | 46 (27.9) | 38 (30.9) | 0.578 |
| BP, mmHg, median (IQR) | ||||
| SBP on admission | 159 (138, 181) | 153 (138, 178) | 164 (139, 186) | 0.116 |
| DBP on admission | 100 (86, 114) | 100 (86, 113) | 100 (88, 118) | 0.275 |
| MAP on admission | 117 (105, 136) | 116 (104, 134) | 121 (106, 141) | 0.186 |
| SBP on discharge | 136 (128, 144) | 135 (126, 143) | 137 (130, 146) | 0.057 |
| DBP on discharge | 82 (77, 90) | 82 (77, 90) | 82 (77, 90) | 0.687 |
| MAP on discharge | 101 (93, 107) | 100 (92, 108) | 102 (95, 107) | 0.211 |
| Laboratory variables, median (IQR) | ||||
| Hemoglobin, g/L | 106 (90, 123) | 99 (85, 116) | 113 (97, 128) | < 0.001 |
| Platelet count× 109/L | 252 (203, 323) | 245 (194, 316) | 262 (210, 332) | 0.221 |
| Serum albumin, g/L | 37.3 (33.3, 40.7) | 36.0 (32.5, 39.9) | 38.5 (34.9, 41.1) | < 0.001 |
| Total cholesterol, mmol/L | 4.7 (4.0, 5.6) | 4.8 (4.0, 5.7) | 4.6 (4.0, 5.6) | 0.555 |
| Triglyceride, mmol/L | 1.77 (1.30, 2.34) | 1.76 (1.27, 2.28) | 1.82 (1.40, 2.43) | 0.217 |
| HDL‐c, mmol/L | 0.99 (0.83, 1.19) | 1.01 (0.86, 1.21) | 0.96 (0.82, 1.15) | 0.124 |
| LDL‐c, mmol/L | 2.98 (2.38, 3.60) | 3.01 (2.45, 3.62) | 2.95 (2.23, 3.58) | 0.189 |
| Urea nitrogen, mmol/L | 15.0 (10.8, 19.9) | 16.1 (12.1, 20.4) | 13.4 (9.5, 19.5) | 0.006 |
| Scr, μmol/L | 566 (326, 847) | 603 (374, 880) | 506 (272, 781) | 0.013 |
| Urea acid, μmol/L | 474 (388, 567) | 465 (384, 561) | 489 (400, 569) | 0.642 |
| eGFR, mL/min per 1.73 m2 | 10.3 (6.4, 19.5) | 9.5 (6.0, 17.1) | 11.9 (7.0, 23.9) | 0.011 |
| C3, g/L | 0.97 (0.84, 1.14) | 0.94 (0.80, 1.10) | 1.00 (0.86, 1.20) | 0.017 |
| C4, g/L | 0.28 (0.23, 0.36) | 0.27 (0.23, 0.35) | 0.30 (0.24, 0.38) | 0.105 |
| 24‐h proteinuria, g/day | 1.42 (0.85, 2.57) | 1.49 (0.88, 2.61) | 1.35 (0.78, 2.57) | 0.565 |
| Medications, n (%) | ||||
| CCB | 278 (96.5) | 161 (97.6) | 117 (95.1) | 0.261 |
| ACEI | 61 (21.2) | 39 (23.6) | 22 (17.9) | 0.237 |
| ARB | 146 (50.7) | 87 (52.7) | 59 (48.0) | 0.424 |
| Sacubitril/valsartan | 64 (22.2) | 36 (21.8) | 28 (22.8) | 0.849 |
| RAS blockers a | 200 (69.4) | 122 (73.9) | 78 (63.4) | 0.055 |
| α blockers | 180 (62.5) | 97 (58.8) | 83 (67.5) | 0.132 |
| β blockers | 248 (89.1) | 140 (84.8) | 108 (87.8) | 0.473 |
| Sulodexide soft capsules | 148 (51.4) | 81 (49.1) | 67 (54.5) | 0.366 |
| Statin | 131 (45.5) | 66 (40.0) | 65 (52.8) | 0.030 |
Abbreviations: ACEI, angiotensin‐converting enzyme inhibitors; ARB, angiotensin receptor blocker; BMI, body mass index; BP, blood Pressure; C3, complement 3; C4, complement 4; CCB, calcium channel blockers; DBP, diastolic blood pressure; eGFR, estimated glomerular filtration rate; HDL‐c, high density lipoprotein cholesterol; LDL‐c, low density lipoprotein cholesterol; MAP, mean arterial pressure; RAS blockers, renin–angiotensin system blockers; SBP, systolic blood pressure; Scr, serum creatinine.
RAS blockers, contain ACEI, ARB, and Sacubitril/valsartan.
With regard to BMI according to age, there was a linear relationship between BMI in percentiles and age (Figure 2). BMI differences between men and women seemed to be on the basis of variation in age. The BMI in percentiles of male was higher than female, consistent with the baseline data in Table 1.
FIGURE 2.
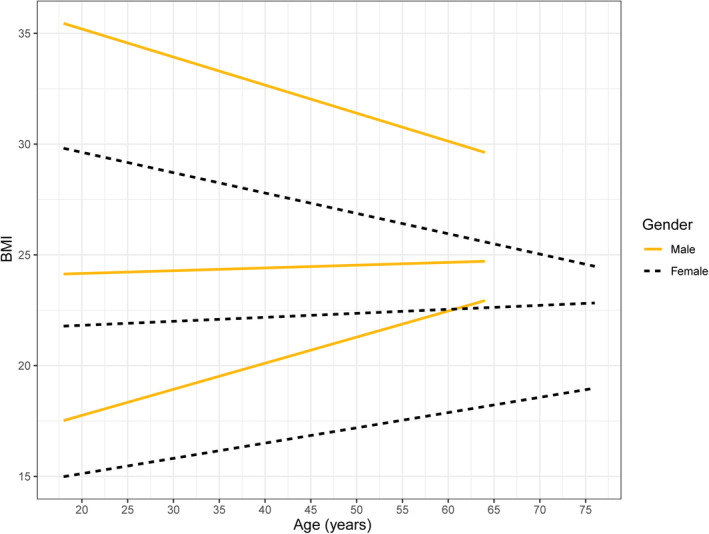
BMI in male and female according to age. There is a positive linear relationship between 5th and 50th percentiles of BMI and age.
3.2. Renal Biopsy and Histopathological Characteristics
All patients with MHT‐associated renal TMA underwent percutaneous renal biopsy. The various histopathologic features of the MHT patients with renal TMA under light microscopy and electron microscopic are shown in Figure 3. Light microscopic analysis revealed typical series of pathological changes in renal TMA, including diffuse capillary loop wrinkling (Figure 3a), marked intimal thickening of renal arterioles (Figure 3b), and vessel wall thickening with “onion‐peel” appearance and luminal occlusion (Figure 3c). In addition, electronic microscopy analysis revealed swelling of endothelial cells, prominent subendothelial widening with flocculent deposits underneath and new base membrane formation, leading to narrowing of capillary lumen (Figure 3d).
FIGURE 3.
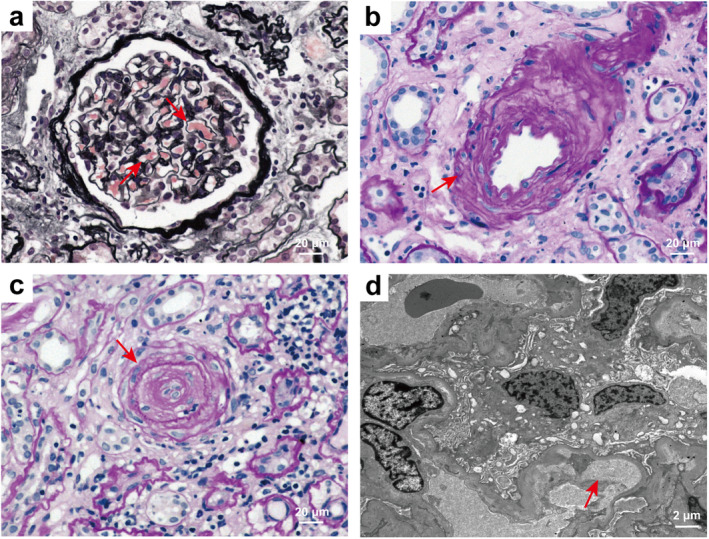
Representative light and electron microscopic findings of MHT patients with TMA. (a) Diffuse capillary loop wrinkling (red arrowheads) (PASM), 400×. (b) Marked intimal thickening of renal arterioles (red arrowheads) (PAS), 400×. (c) Arteriolar endothelial cell swelling, vessel wall thickening, and luminal occlusion with an “onion‐peel” appearance (red arrowheads) (PAS), 400×. (d) Electronic micrograph showed swelling of endothelial cells, capillary loop wrinkling, prominent subendothelial widening with flocculent material underneath, and new base membrane formation, leading to narrowing of capillary lumen (red arrowheads), 5000×. PASM, periodic acid–silver methenamine; PAS, periodic acid‐Schiff.
The pathological characteristics in MHT patients with renal TMA according to the BMI level are shown in Table 2. IgAN was diagnosed in 83 (28.8%) of patients. Compared to lean patients, a higher incidence of IgAN was seen in patients with overweight or obesity (35.2% vs. 20.3%, p = 0.006). The median global sclerosis ratio was 37.5% (IQR 18.6–66.7) in the lean group and 28.6% (IQR 18.8–51.9) in the overweight group, with no significant difference between the two groups. Furthermore, in the lean group, the majority of patients (76.8%) had tubular atrophy and interstitial fibrosis involving > 50% of the renal biopsy area. Regarding vascular lesions, more than half of the patients in this study showed arteriolar hyalinosis and onion skin lesions (52.4% and 59.7%, respectively). However, fibrinoid necrosis and intravascular thrombosis were occasionally observed, occurring in 96 (33.3%) and 52 (18.1%) patients, respectively. There were no significant differences in tubulointerstitial and vascular pathological characteristics between the two groups.
TABLE 2.
Histopathologic findings.
| Characteristics | Total (n = 288) | BMI | p | |
|---|---|---|---|---|
| < 25 (n = 165) | ≥ 25 (n = 123) | |||
| With IgAN, n (%) | 83 (28.8) | 58 (35.2) | 25 (20.3) | 0.006 |
| Global lesions, n (%) | ||||
| Global sclerosis, number, median (IQR) | 8 (4, 13) | 9 (4, 14) | 7 (4, 12) | 0.259 |
| Global sclerosis ratio, n (%) | 33.3 (18.8, 59.0) | 37.5 (18.6, 66.7) | 28.6 (18.8, 51.9) | 0.121 |
| Segmental sclerosis, number, median (IQR) | 0.5 (0.0, 2.0) | 0.00 (0.00, 1.00) | 1.00 (0.00, 2.00) | 0.808 |
| Segmental sclerosis, n (%) | 0.01 (0.00, 6.25) | 0.00 (0.00, 6.67) | 2.00 (0.00, 6.06) | 0.909 |
| Tubular lesions, n (%) | ||||
| IFTA | 0.187 | |||
| < 50 | 66 (23.2) | 33 (20.4) | 33 (27.4) | |
| ≥ 50 | 218 (76.8) | 129 (79.6) | 89 (73.0) | |
| Tubular epithelial cell exfoliation | 99 (34.4) | 60 (36.4) | 39 (31.7) | 0.411 |
| Vascular lesions, n (%) | ||||
| Acute lesions | ||||
| Fibrinoid necrosis | 96 (33.3) | 56 (33.9) | 40 (32.5) | 0.800 |
| Intravascular thrombosis | 52 (18.1) | 33 (20.0) | 19 (15.4) | 0.320 |
| Intravascular RBC fragments | 29 (10.1) | 21 (12.7) | 8 (6.5) | 0.083 |
| Chronic lesions | ||||
| Onion skin lesions | 172 (59.7) | 104 (63.0) | 68 (55.3) | 0.185 |
| Arteriolar hyalinosis | 151 (52.4) | 81 (49.1) | 70 (56.9) | 0.189 |
Abbreviations: IFTA, tubular atrophy/interstitial fibrosis; IgAN, IgA nephropathy; RBC, red blood cell.
3.3. Risk Factors for Kidney Failure Occurrence of MHT Patients With Renal TMA
Renal function outcome for the incidence of kidney failure at baseline was analyzed in 288 patients. Among all patients, 180 (62.5%) progressed to kidney failure, including 113 patients with BMI < 25 kg/m2 and 67 patients with BMI ≥ 25 kg/m2. In the univariate logistic regression analysis, we found that lower odds of kidney failure were related to BMI ≥ 25 kg/m2 (Table 3). Associations of BMI with kidney failure were studied by Logistic regression models after adjustment for age, sex, serum albumin, proteinuria, urea acid, renin‐angiotensin system (RAS) blockers treatment, global sclerosis ratio, onion skin lesions and IFTA in multivariate analyses.
TABLE 3.
Risk factors of kidney failure for MHT patients with TMA according to BMI.
| Variables | Kidney failure | |||||
|---|---|---|---|---|---|---|
| Univariate analysis | Multivariate analysis | |||||
| OR | 95% CI | p | adjusted OR | 95% CI | p | |
| BMI, kg/m2 | ||||||
| < 25 | 1 (ref) | 1 (ref) | ||||
| ≥ 25 | 0.55 | 0.34–0.89 | 0.016 | 0.49 | 0.27–0.91 | 0.025 |
| Age (per, years) | 0.99 | 0.97–1.02 | 0.586 | 1.01 | 0.98–1.05 | 0.585 |
| Sex, male (vs. female) | 2.74 | 1.29–5.81 | 0.008 | 7.05 | 2.34–21.22 | 0.001 |
| Hemoglobin, g/L | 0.95 | 0.94–0.96 | < 0.001 | — | — | |
| Serum albumin, g/L | 0.91 | 0.86–0.96 | < 0.001 | 0.91 | 0.85–0.98 | 0.011 |
| Scr, μmol/L | 1.03 | 1.02–1.03 | < 0.001 | — | — | |
| eGFR, mL/min per 1.73 m2 | 0.54 | 0.46–0.64 | < 0.001 | — | — | |
| C3, g/L | 0.27 | 0.08–0.89 | 0.031 | — | — | |
| Proteinuria, g/24 h | 1.48 | 1.20–1.82 | < 0.001 | 1.19 | 0.93–1.51 | 0.169 |
| Uric acid, μmol/L | 1.004 | 1.002–1.006 | < 0.001 | 1.003 | 1.001–1.006 | 0.005 |
| RAS blockers treatment | 0.44 | 0.25–0.77 | 0.004 | 0.43 | 0.22–0.85 | 0.016 |
| With IgAN | 1.36 | 0.79–2.32 | 0.268 | — | — | |
| Global sclerosis ratio, % | 1.02 | 1.01–1.03 | < 0.001 | 1.02 | 1.01–1.04 | 0.001 |
| IFTA, % | ||||||
| ≤ 50 | 1 (ref) | 1 (ref) | ||||
| > 50 | 2.93 | 1.67–5.16 | < 0.001 | 1.88 | 0.95–3.71 | 0.069 |
| Fibrinoid necrosis | 0.88 | 0.53–1.45 | 0.606 | — | — | |
| Intravascular thrombosis | 1.16 | 0.62–2.18 | 0.635 | — | — | |
| Arteriolar hyalinosis | 0.54 | 0.33–0.87 | 0.012 | 0.66 | 0.36–1.19 | 0.166 |
| Onion skin lesions | 1.79 | 1.10–2.91 | 0.019 | 2.40 | 1.29–4.45 | 0.005 |
Abbreviations: BMI, body mass index; C3, complement 3; CI, confidence interval; eGFR, estimated glomerular filtration rate; IFTA, tubular atrophy/interstitial fibrosis; IgAN, IgA nephropathy; OR, odd ratio; RAS blockers, renin–angiotensin system blockers; Scr, serum creatinine.
Compared to patients with a normal BMI, those with a higher BMI had an inverse association with kidney failure (Table 3). In the multivariable logistic regression analysis, we also revealed that BMI ≥ 25 kg/m2 was associated with lower odds of kidney failure (adjusted OR 0.49; 95% CI 0.27–0.91; p = 0.025). Meanwhile, male gender (adjusted OR 7.05; 95% CI 2.34–21.22; p = 0.001), uric acid levels (adjusted OR 1.003; 95% CI 1.001–1.006; p = 0.005), presence of onion skin lesions (adjusted OR 2.40; 95% CI 1.29–4.45; p = 0.005), and global sclerosis ratio (adjusted OR 1.02; 95% CI 1.01–1.04; p = 0.001) were risk factors for kidney failure of MHT patients with TMA (Table 3). Moreover, serum albumin (adjusted OR 0.91; 95% CI 0.85–0.98; p = 0.011) and treatment with RAS blockers were protective factors of renal function outcome (adjusted OR 0.43; 95% CI 0.22–0.85; p = 0.016) (Table 3).
To further explore the difference in BMI for kidney outcome under stratification factors, we tested the interaction between BMI and several factors on kidney failure (Table S1). Although there were no significant differences between BMI and the factors shown in Table S1, we found that overweight or obesity was associated with a decreased risk of kidney failure in those over 35 years. In addition, the results of stratified analysis according to male, proteinuria ≤ 1.42 g/day and the presence of IgAN showed that the lean group was also associated with an increased risk of kidney failure.
3.4. Mandatory BP Lowering Improves Renal Function Recovery
To investigate the role of mandatory BP lowering on prognosis of MHT patients with renal TMA, we conducted a subgroup analysis on various renal outcomes to examine the significance of intensive BP lowering (Table 4). Among patients with a BMI < 25 kg/m2, those who did not undergo intensive SBP lowering had a higher incidence of kidney failure, highlighting the need for SBP lowering even in normal weight individuals. Furthermore, patients who underwent intensive SBP lowering had a higher rate of renal recovery of ≥ 25% reduction in serum creatinine level from baseline, or a return to normal creatinine level, or dialysis independence for 4 weeks and ≥ 15% increase in the eGFR in the BMI ≥ 25 kg/m2 group. This indicates the significant benefit of intensive BP management for individuals with overweight or obesity.
TABLE 4.
Renal survival in different BMI groups according to intensive lowering SBP categories.
| < 25 kg/m2 | ≥ 25 kg/m2 | |||||
|---|---|---|---|---|---|---|
| ≤ 130 mmHg | > 130 mmHg | p | ≤ 130 mmHg | > 130 mmHg | p | |
| kidney failure, n (%) | 38 (59.4) | 75 (74.3) | 0.046 | 19 (52.8) | 48 (55.2) | 0.808 |
| Long term RRT, n (%) | 18 (32.7) | 46 (56.8) | 0.079 | 16 (48.5) | 33 (45.2) | 0.129 |
| Recovery1 a , n (%) | 15 (27.8) | 25 (33.3) | 0.542 | 11 (33.3) | 22 (33.8) | 0.832 |
| Recovery2 b , n (%) | 34 (63.0) | 40 (52.6) | 0.089 | 21 (63.6) | 38 (56.7) | 0.035 |
| Recovery3 c , n (%) | 14 (31.8) | 22 (44.0) | 0.540 | 16 (69.6) | 24 (50.0) | 0.008 |
Abbreviation: RRT, renal replacement therapy.
Recovery1: ≥ 50% reduction in serum creatinine level from baseline, or a return to normal creatinine levels, or dialysis independence for 4 weeks.
Recovery2: ≥ 25% reduction in serum creatinine level from baseline, or a return to normal creatinine levels, or dialysis independence for 4 weeks.
Recovery3: ≥ 15% increase in the eGFR.
4. Discussion
In this study, participants with a BMI ≥ 25 kg/m2 had higher levels of hemoglobin, serum albumin, eGFR, and C3. Conversely, patients with overweight or obesity had lower levels of serum creatinine, urea nitrogen, and IgAN. Interestingly, a higher BMI was linked to a lower risk for kidney failure in MHT patients with renal TMA. We also observed that the male gender, uric acid, presence of onion skin lesions, and global sclerosis ratio were associated with increasing odds of kidney failure, and serum albumin and the use of RAS blockers were found to be protective factors in multivariable regression.
The prevalence of obesity is increasing worldwide. Globally, adults with a BMI > 25 kg/m2 increased from 28.8% for men and 29.8% for women in 1980%–36.9% for men and 38% for women in 2013 [18]. Alcazar et al. also discovered BMI increased significantly in young and middle‐aged women and men [19]. In particular, Framingham Offspring Study suggested that obesity is responsible for 78% of hypertension in men and 65% of hypertension in women [20, 21]. BMI is strongly associated with all‐cause mortality. Surprisingly, a retrospective cohort study of acute severe hypertension found that patients with BMI > 25 kg/m2 had a reduction of risk in the 3‐year all‐cause mortality [22]. Although overweight or obesity is an important clinical characteristic of patients with hypertension, few studies have attempted to demonstrate the effect of BMI on kidney failure in MHT patients with renal TMA. Thus, we investigated the clinical features and renal prognosis between BMI and MHT.
Indeed, we found that individuals with overweight or obesity was associated with lower odds of kidney failure compared to those with a BMI < 25 kg/m2. Compared with the overweight group in our study, about 15% higher prevalence of IgAN occurred in the lean group. Importantly, it is reported that patients with IgAN had high proteinuria and almost all patients were at risk of progression to kidney failure within their expected lifetime in an IgA nephropathy cohort [23, 24]. This may partly explain the higher risk of kidney failure in lean patients. Furthermore, the obesity paradox, which is a paradoxical decrease in mortality concomitant with increased BMI, is a possible reason of the lower risk of kidney failure with increased BMI. This phenomenon has been observed in various populations, including the elderly, those with CKD, and hypertension [25, 26, 27]. Matsuki et al. suggested that the underweight group had a marked increase in the risk of mortality, whereas the overweight group tended to have reduced rates of acute hypertension. Meanwhile, the overweight group also showed a lower risk of urgent dialysis [28], supporting our study in MHT. In addition, various studies conducted on middle‐aged and elderly patients with hypertension found that the overweight and obesity group had a decreased mortality risk compared to those with a normal weight [29, 30]. This is consistent with the lower risk of kidney failure observed in patients over 35 years of age with overweight or obesity in the present study. The obesity paradox can be explained by the presence of reverse causation, such as underlying comorbidities causing weight loss and sarcopenia, but nutritional approaches to preserve metabolic reserve may improve the outcome of MHT [28, 31].
TMA is an important predictor of renal insufficiency and recovery in MHT [32]. El Karoui K et al. suggested that the presence of evidence of TMA was associated with a decline in GFR during the follow‐up compared to patients with renal TMA lesions alone [24]. Anemia and/or thrombocytopenia, low haptoglobin, presence of schizocytes, elevated lactate dehydrogenase in patients with MH may serve as risk factors for renal failure [32]. In this cohort, we observed that individuals with normal weight had significantly lower hemoglobin levels and worse renal function, suggesting more severe TMA and worse renal outcomes in patients with normal BMI. We analyzed the possible reasons. On the one hand, in our cohort, the proportion of IgAN was higher in patients with normal BMI (58 [35.2%] in the BMI < 25 kg/m2 group vs. 25 [20.3%] in the BMI ≥ 25 kg/m2 group), suggesting that the hemoglobin level was influenced by the primary glomerulopathy. On the other hand, previous studies have reported a positive association between hemoglobin levels and BMI, which may partially explain the lower hemoglobin levels in the lower BMI group [33]. However, the underlying reasons and mechanisms behind the relationship between hemoglobin and renal function in different BMI categories require further investigation.
Recently, obesity has been reported to be an important risk factor for IgAN patients when accompanied by hypertension. Hypertension appears to be prevalent in obese IgAN patients, and weight reduction has been recommended to reduce proteinuria in overweight IgAN patients, which may delay the progression of renal dysfunction [34, 35]. However, our study found that patients with BMI < 25 had higher prevalence of IgAN and increased the risk of kidney failure, contrary to the previous studies. These discrepancies may be due to differences in the study populations and the proportion of IgAN cases. In addition, this study was limited by its sample size, and further research with a larger cohort is needed to explore the relationship between obesity and renal prognosis in MHT.
Glomerulosclerosis is generally associated with interstitial fibrosis, interstitial inflammation, arteriohyalinosis, and arteriosclerosis, and this constellation of changes typifies nephrosclerosis [36]. A biopsy‐based cohort study of CKD identified that the percentage of segmental/global glomerulosclerosis and IFTA are risk factors for CKD progression [37]. In renal TMA induced by severe hypertension, it is reported that renal histology showed a TMA involving preglomerular arterioles and/or interlobular arteries characterized by fibrin deposits and vascular wall sclerosis. Progressive focal tubular atrophy and interstitial fibrosis were also observed [38]. Notably, our analysis confirmed that those biopsy risk factors of global glomerulosclerosis ratio and presence of onion skin lesions were associated with kidney failure in MHT patients with renal TMA, underlying the severity of renal pathological changes in TMA.
The renin‐angiotensin system is greatly activated in MHT [39]. Meanwhile, intra‐renal generation of angiotensin 2 and exposure of the microcirculation to elevated BP cooperate in causing tissue damage in MHT [40]. RAS blockers share a specific anti‐proteinuric effect and are useful in hypertensive urgencies [41]. González et al. have proposed that the availability of RAS blockers in recent decades may be related to the improvement in the long‐term renal prognosis of MHT [42]. We also found RAS blockers a protective factor for kidney failure in MHT, consistent with the previous studies. Aggressive management of BP is effective in resolving TMA related to MHT and at least partially restoring renal function [38]. However, Timmermans et al. demonstrated that defects in complement regulation are a key causative factor in patients with TMA attributed to severe hypertension. They suggested focusing on the use of complement inhibition in patients with abnormal test results of ex vivo complement activation on the endothelium and variants in complement genes [43, 44]. Thus, further investigation is needed to determine the use of complement inhibitors in MHT‐associated renal TMA.
Our study has limitations that need to be acknowledged. The population of our study was limited as patients with a BMI under 18.5 kg/m2 or over 30 kg/m2 are rare. Therefore, we were unable to investigate each BMI level according to WHO. In addition, there may have been changes in BMI over time, which we could not account for. The use of BMI does not account for fat distribution or degree of visceral adiposity. However, BMI is the most clinically relevant measure and allows for broader generalizability of findings. Moreover, this study was conducted at a single center and may not be representative of the entire population in China. In addition, the presence of other distinct glomerular diseases might contribute to renal prognosis and outcomes in MHT, which requires to be further investigation.
5. Conclusion
In summary, we have identified that normal weight, rather than overweight or obesity, was associated with a worse renal outcome of kidney failure in MHT patients with renal TMA. The ideal BMI and the best ways to achieve this BMI need to be established from randomized controlled clinical trials. Clinicians should make an appropriate approach and management including lifestyle modifications such as diet control and exercise, considering their comorbidities and BMI itself.
Disclosure
We declare that the results presented in this paper have not been published previously in whole or part, except in abstract format.
Conflicts of Interest
The authors declare no conflicts of interest.
Supporting information
Table S1.
Acknowledgments
All authors contributed to each of the following aspects of the study: Feng He, Zhaocai Zhou, and Sheng Zhao participated in the acquisition, analysis, or interpretation of data for the work. Wenchuan Li, Xingji Lian, and Jianwen Yu participated in drafting the work or revising it critically for important intellectual content. Zhengmei Lin and Zhi Song ensured the accuracy or integrity of any part of the work. Wei Chen and Jianbo Li contributed to the design of the work and final approval of the version to be published. Feng He, Zhaocai Zhou, and Sheng Zhao take responsibility for the accuracy and integrity of the data analysis.
Feng He, Zhaocai Zhou and Sheng Zhao contributed equally to this work.
Funding: This study was supported by grants from the National Natural Science Foundation of China (82070752, 82170737, 82370707), National Key Research and Development Project of China (2021YFC2501302), Guangdong Natural Science Foundation (Grant 2022B1515020106, 2023A1515012477), Key Laboratory of National Health Commission, and Key Laboratory of Nephrology, Guangdong Province, Guangzhou, China (2002B60118 and 2020B1212060028), the Guangzhou Planned Project of Science and Technology (Grant 202201020273), and Guangzhou Municipal Programme of Science and Technology (2024B03J1337).
Contributor Information
Feng He, Email: eyhefeng@scut.edu.cn.
Jianbo Li, Email: lijianb5@mail.sysu.edu.cn.
Data Availability Statement
The datasets generated and/or analyzed during the current study are not publicly available due to privacy and ethical restrictions but are available from the corresponding author on reasonable request.
References
- 1. Fakhouri F. and Frémeaux‐Bacchi V., “Thrombotic Microangiopathy in Ahus and Beyond: Clinical Clues From Complement Genetics,” Nature Reviews. Nephrology 17 (2021): 543–553. [DOI] [PubMed] [Google Scholar]
- 2. van den Born B. J., Koopmans R. P., Groeneveld J. O., et al., “Ethnic Disparities in the Incidence, Presentation and Complications of Malignant Hypertension,” Journal of Hypertension 24 (2006): 2299–2304. [DOI] [PubMed] [Google Scholar]
- 3. Lip G. Y., Beevers M., and Beevers D. G., “Complications and Survival of 315 Patients With Malignant‐Phase Hypertension,” Journal of Hypertension 13 (1995): 915–924. [DOI] [PubMed] [Google Scholar]
- 4. Lusco M. A., Najafian B., Alpers C. E., and Fogo A. B., “Ajkd Atlas of Renal Pathology: Arterionephrosclerosis,” American Journal of Kidney Diseases 67 (2016): 21–22. [DOI] [PubMed] [Google Scholar]
- 5. Barbour T., Johnson S., Cohney S., and Hughes P., “Thrombotic Microangiopathy and Associated Renal Disorders,” Nephrology, Dialysis, Transplantation 27 (2012): 2673–2685. [DOI] [PMC free article] [PubMed] [Google Scholar]
- 6. Cavero T., Auñón P., Caravaca‐Fontán F., et al., “Thrombotic Microangiopathy in Patients With Malignant Hypertension,” Nephrology, Dialysis, Transplantation 38 (2023): 1217–1226. [DOI] [PubMed] [Google Scholar]
- 7. Brocklebank V., Wood K. M., and Kavanagh D., “Thrombotic Microangiopathy and the Kidney,” Clinical Journal of the American Society of Nephrology 13 (2018): 300–317. [DOI] [PMC free article] [PubMed] [Google Scholar]
- 8. Lu J. L., Kalantar‐Zadeh K., Ma J. Z., Quarles L. D., and Kovesdy C. P., “Association of Body Mass Index With Outcomes in Patients With Ckd,” Journal of the American Society of Nephrology 25 (2014): 2088–2096. [DOI] [PMC free article] [PubMed] [Google Scholar]
- 9. Hall J. E., Do Carmo J. M., Da Silva A. A., et al., “Obesity, Kidney Dysfunction and Hypertension: Mechanistic Links,” Nature Reviews. Nephrology 15 (2019): 367–385. [DOI] [PMC free article] [PubMed] [Google Scholar]
- 10. Esler M., Lambert G., Schlaich M., Dixon J., Sari C. I., and Lambert E., “Obesity Paradox in Hypertension: Is This Because Sympathetic Activation in Obesity‐Hypertension Takes a Benign Form?,” Hypertension 71 (2018): 22–33. [DOI] [PubMed] [Google Scholar]
- 11. Shantsila A., Lane D. A., Beevers D. G., and Lip G. Y. H., “Does Obesity Influence Target Organ Damage and Outcomes in Patients With Malignant Phase Hypertension? The West Birmingham Malignant Hypertension Project,” Hypertension Research 36 (2013): 546–549. [DOI] [PubMed] [Google Scholar]
- 12. Obesity: Preventing and Managing the Global Epidemic. Report of a Who Consultation,” World Health Organization Technical Report Series 894 (2000): 1–253. [PubMed] [Google Scholar]
- 13. Williams B., Mancia G., Spiering W., et al., “2018 Esc/Esh Guidelines for the Management of Arterial Hypertension,” European Heart Journal 39 (2018): 3021–3104. [DOI] [PubMed] [Google Scholar]
- 14. Cremer A., Amraoui F., Lip G. Y., et al., “From Malignant Hypertension to Hypertension‐Mod: A Modern Definition for an Old but Still Dangerous Emergency,” Journal of Human Hypertension 30 (2016): 463–466. [DOI] [PubMed] [Google Scholar]
- 15. Levey A. S., Stevens L. A., Schmid C. H., et al., “A New Equation to Estimate Glomerular Filtration Rate,” Annals of Internal Medicine 150 (2009): 604–612. [DOI] [PMC free article] [PubMed] [Google Scholar]
- 16. Zhang W., Zhang S., Deng Y., et al., “Trial of Intensive Blood‐Pressure Control in Older Patients With Hypertension,” New England Journal of Medicine 385 (2021): 1268–1279. [DOI] [PubMed] [Google Scholar]
- 17. Whelton P. K., Carey R. M., Aronow W. S., et al., “2017 Acc/Aha/Aapa/Abc/Acpm/Ags/Apha/Ash/Aspc/Nma/Pcna Guideline for the Prevention, Detection, Evaluation, and Management of High Blood Pressure in Adults: Executive Summary: A Report of the American College of Cardiology/American Heart Association Task Force on Clinical Practice Guidelines,” Circulation 138 (2018): 426–483. [DOI] [PubMed] [Google Scholar]
- 18. Seravalle G. and Grassi G., “Obesity and Hypertension,” Pharmacological Research 122 (2017): 1–7. [DOI] [PubMed] [Google Scholar]
- 19. Alcazar J., Rodriguez‐Lopez C., Delecluse C., Thomis M., and van Roie E., “Ten‐Year Longitudinal Changes in Muscle Power, Force, and Velocity in Young, Middle‐Aged, and Older Adults,” Journal of Cachexia, Sarcopenia and Muscle 14 (2023): 1019–1032. [DOI] [PMC free article] [PubMed] [Google Scholar]
- 20. Forman J. P., Stampfer M. J., and Curhan G. C., “Diet and Lifestyle Risk Factors Associated With Incident Hypertension in Women,” JAMA 302 (2009): 401–411. [DOI] [PMC free article] [PubMed] [Google Scholar]
- 21. Garrison R. J., Kannel W. B., J. Stokes, III , et al., “Incidence and Precursors of Hypertension in Young Adults: The Framingham Offspring Study,” Preventive Medicine 16 (1987): 235–251. [DOI] [PubMed] [Google Scholar]
- 22. Kim H. J., Kim B. S., Lee J. H., and Shin J. H., “Impact of Underweight on 3‐Year All‐Cause Mortality in Patients With Acute Severe Hypertension: A Retrospective Cohort Study,” Scientific Reports 12 (2022): 4798. [DOI] [PMC free article] [PubMed] [Google Scholar]
- 23. Pitcher D., Braddon F., Hendry B., et al., “Long‐Term Outcomes in Iga Nephropathy,” Clinical Journal of the American Society of Nephrology 18 (2023): 727–738. [DOI] [PMC free article] [PubMed] [Google Scholar]
- 24. El Karoui K., Hill G. S., Karras A., et al., “A Clinicopathologic Study of Thrombotic Microangiopathy in Iga Nephropathy,” Journal of the American Society of Nephrology 23 (2012): 137–148. [DOI] [PMC free article] [PubMed] [Google Scholar]
- 25. Uretsky S., Messerli F. H., Bangalore S., et al., “Obesity Paradox in Patients With Hypertension and Coronary Artery Disease,” American Journal of Medicine 120 (2007): 863–870. [DOI] [PubMed] [Google Scholar]
- 26. Kalantar‐Zadeh K., Rhee C. M., Chou J., et al., “The Obesity Paradox in Kidney Disease: How to Reconcile It With Obesity Management,” Kidney International Reports 2 (2017): 271–281. [DOI] [PMC free article] [PubMed] [Google Scholar]
- 27. Park J., Ahmadi S. F., Streja E., et al., “Obesity Paradox in End‐Stage Kidney Disease Patients,” Progress in Cardiovascular Diseases 56 (2014): 415–425. [DOI] [PMC free article] [PubMed] [Google Scholar]
- 28. Matsuki H., Genma T., Mandai S., et al., “National Trends in Mortality and Urgent Dialysis After Acute Hypertension in Japan From 2010 Through 2019,” Hypertension 80 (2023): 2591–2600. [DOI] [PubMed] [Google Scholar]
- 29. Zhu J., Liu X., Zhang J., et al., “Time‐Varying Association Between Body Mass Index and All‐Cause Mortality in Patients With Hypertension,” International Journal of Obesity 46 (2022): 316–324. [DOI] [PubMed] [Google Scholar]
- 30. Chung W. S., Ho F. M., Cheng N. C., Lee M. C., and Yeh C. J., “Bmi and All‐Cause Mortality Among Middle‐Aged and Older Adults in Taiwan: A Population‐Based Cohort Study,” Public Health Nutrition 18 (2015): 1839–1846. [DOI] [PMC free article] [PubMed] [Google Scholar]
- 31. Naderi N., Kleine C. E., Park C., et al., “Obesity Paradox in Advanced Kidney Disease: From Bedside to the Bench,” Progress in Cardiovascular Diseases 61 (2018): 168–181. [DOI] [PMC free article] [PubMed] [Google Scholar]
- 32. van den Born B. J., Honnebier U. P., Koopmans R. P., et al., “Microangiopathic Hemolysis and Renal Failure in Malignant Hypertension,” Hypertension 45 (2005): 246–251. [DOI] [PubMed] [Google Scholar]
- 33. Auvinen J., Tapio J., Karhunen V., et al., “Systematic Evaluation of the Association Between Hemoglobin Levels and Metabolic Profile Implicates Beneficial Effects of Hypoxia,” Science Advances 7 (2021): eabi4822. [DOI] [PMC free article] [PubMed] [Google Scholar]
- 34. Wang S., Qin A., Dong L., Tan J., Zhou X., and Qin W., “Association of Obesity With the Development of End Stage Renal Disease in Iga Nephropathy Patients,” Frontiers in Endocrinology 14 (2023): 1094534. [DOI] [PMC free article] [PubMed] [Google Scholar]
- 35. Kittiskulnam P., Kanjanabuch T., Tangmanjitjaroen K., Chancharoenthana W., Praditpornsilpa K., and Eiam‐Ong S., “The Beneficial Effects of Weight Reduction in Overweight Patients With Chronic Proteinuric Immunoglobulin a Nephropathy: A Randomized Controlled Trial,” Journal of Renal Nutrition 24 (2014): 200–207. [DOI] [PubMed] [Google Scholar]
- 36. John R., “Heptinstall's Pathology of the Kidney,” Journal of Clinical Pathology 68 (2015): 252. [Google Scholar]
- 37. Yamanouchi M., Hoshino J., Ubara Y., et al., “Clinicopathological Predictors for Progression of Chronic Kidney Disease in Nephrosclerosis: A Biopsy‐Based Cohort Study,” Nephrology, Dialysis, Transplantation 34 (2019): 1182–1188. [DOI] [PubMed] [Google Scholar]
- 38. Zhang B., Xing C., Yu X., et al., “Renal Thrombotic Microangiopathies Induced by Severe Hypertension,” Hypertension Research 31 (2008): 479–483. [DOI] [PubMed] [Google Scholar]
- 39. Kitiyakara C. and Guzman N. J., “Malignant Hypertension and Hypertensive Emergencies,” Journal of the American Society of Nephrology 9 (1998): 133–142. [DOI] [PubMed] [Google Scholar]
- 40. Fleming S., “Malignant Hypertension–The Role of the Paracrine Renin‐Angiotensin System,” Journal of Pathology 192 (2000): 135–139. [DOI] [PubMed] [Google Scholar]
- 41. Jafar T. H., Schmid C. H., Landa M., et al., “Angiotensin‐Converting Enzyme Inhibitors and Progression of Nondiabetic Renal Disease. A Meta‐Analysis of Patient‐Level Data,” Annals of Internal Medicine 135 (2001): 73–87. [DOI] [PubMed] [Google Scholar]
- 42. González R., Morales E., Segura J., et al., “Long‐Term Renal Survival in Malignant Hypertension,” Nephrology, Dialysis, Transplantation 25 (2010): 3266–3272. [DOI] [PubMed] [Google Scholar]
- 43. Timmermans S., Abdul‐Hamid M. A., Vanderlocht J., et al., “Patients With Hypertension‐Associated Thrombotic Microangiopathy May Present With Complement Abnormalities,” Kidney International 91 (2017): 1420–1425. [DOI] [PubMed] [Google Scholar]
- 44. Timmermans S., Wérion A., Damoiseaux J., et al., “Diagnostic and Risk Factors for Complement Defects in Hypertensive Emergency and Thrombotic Microangiopathy,” Hypertension 75 (2020): 422–430. [DOI] [PubMed] [Google Scholar]
Associated Data
This section collects any data citations, data availability statements, or supplementary materials included in this article.
Supplementary Materials
Table S1.
Data Availability Statement
The datasets generated and/or analyzed during the current study are not publicly available due to privacy and ethical restrictions but are available from the corresponding author on reasonable request.