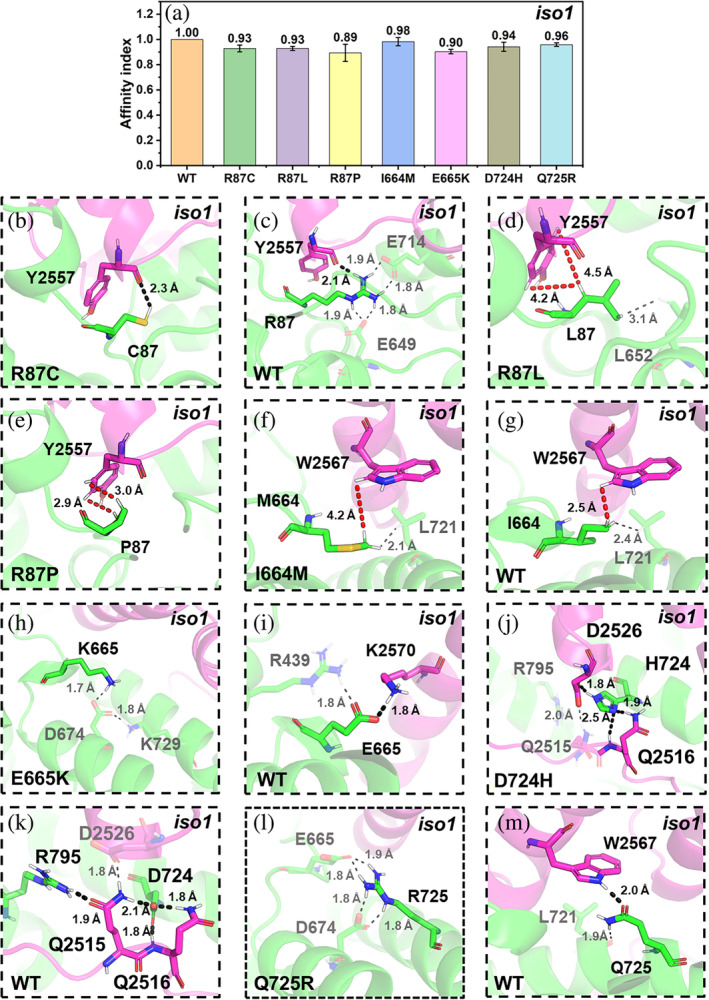
FIGURE 5.

ASD‐related mutations at the CYFIP2iso1/WAVE 1 interface. (a) The affinity index between CYFIP2iso1 and WAVE1 in C2iso1,WT·WRC and the corresponding variants. The values are represented as mean ± SD (N = 3). (b–m) Alterations associated with the R87C/L/P (b–e), I664M (f, g), E665K (h, i), D724H (j, k), and Q725R (l, m) mutations. The CYFIP2iso1 and WAVE1 backbones are shown in Figure 2. Selected residues at the interfaces are represented by sticks. Only hydrogen atoms bound to polar groups or participating in hydrophobic interactions are shown. H‐bonds and van der Waals interactions are represented as black and red dashed lines, respectively.
