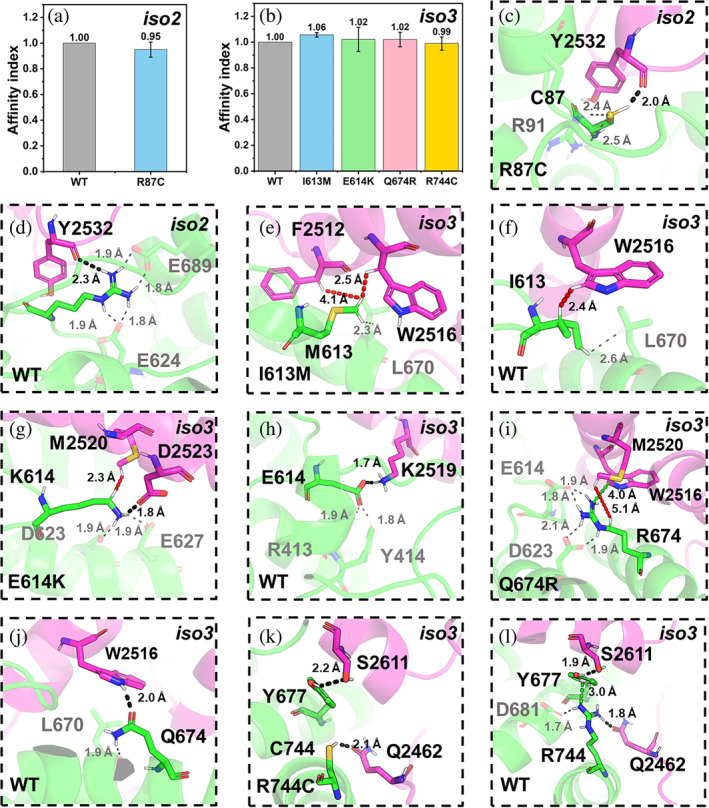
FIGURE 7.

ASD‐related mutations at the CYFIP2iso2–3/WAVE1 interface. (a, b) The affinity indexes for the WT and the mutants at the interface. The values are represented as mean ± SD (N = 3). (c–l) Alterations associated with R87C(CYFIP2iso2) (c, d), I613M(CYFIP2iso3) (e, f), E614K(CYFIP2iso3) (g, h), Q674R(CYFIP2iso3) (i, j) R744C(CYFIP2iso3) (k, l). The color scheme as in Figure 5. Cation–π interactions are shown as a green dashed line.
