FIGURE 9.

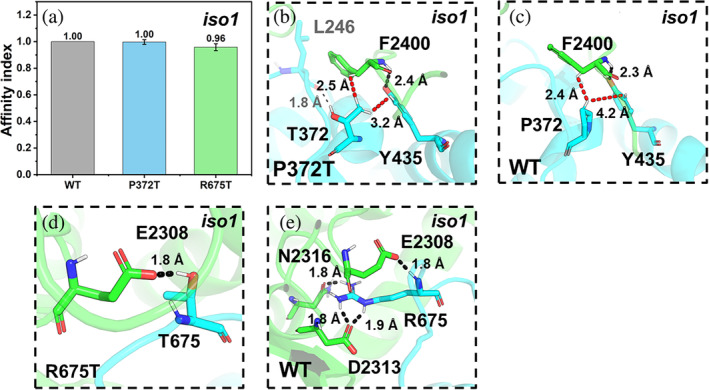
ASD‐related mutations at the CYFIP2iso1/NCKAP1iso2 interface. (a) The affinity indexes of the mutants. Values are represented as mean ± SD (N = 3). (b–e) Alterations associated with the P372T (b, c) and R675T (d, e) mutations.

ASD‐related mutations at the CYFIP2iso1/NCKAP1iso2 interface. (a) The affinity indexes of the mutants. Values are represented as mean ± SD (N = 3). (b–e) Alterations associated with the P372T (b, c) and R675T (d, e) mutations.