Figure 6.
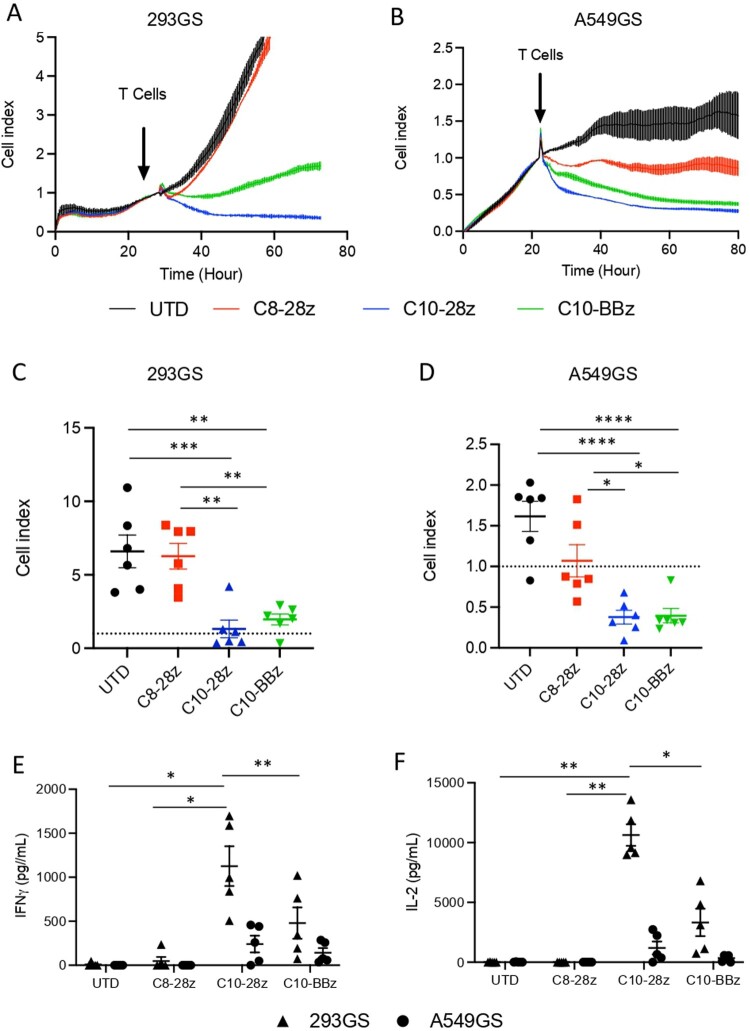
Evaluation of second generation CAR-T cell activity against Spike-expresing cells. (A,B) Graphical representation of cell index data obtained through the RTCA xCELLigence over-time. (C, D) Grouped analysis of CAR-T cell cytotoxicity against 293GS and A549GS cell lines at 48 h. Values are from 6 independent experiments. (E, F) Quantification of IL-2 and IFNγ at 24 h post co-culture of CAR-T cells with target cells. Values are from 5 independent measurements. Significance was assigned as follows: ∗p < 0.05, ∗∗p < 0.01, ∗∗∗p < 0.001, and ∗∗∗∗p < 0.0001.

