Figure 7.
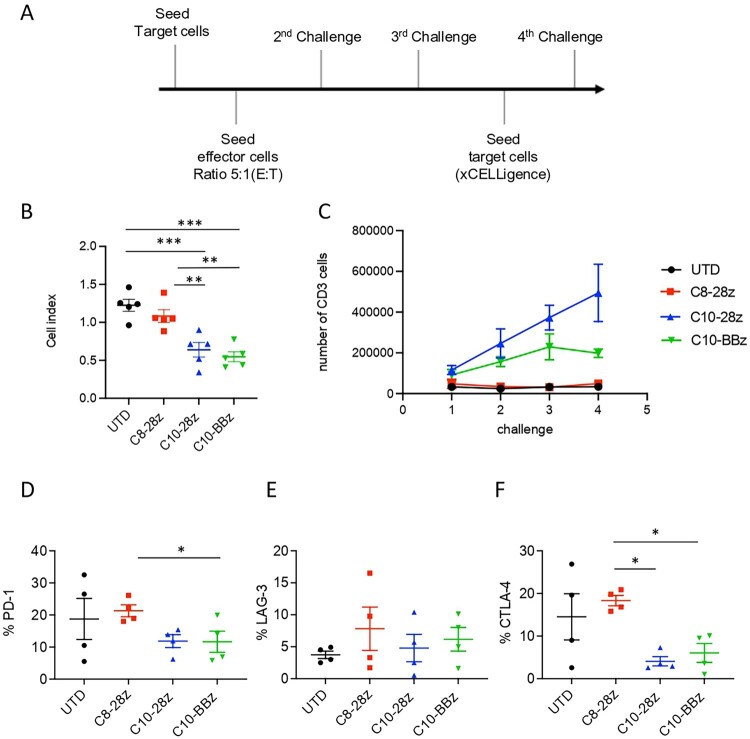
Evaluation of in vitro CAR-T cell persistence. (A) Schematic representation of rechallenge experiment time course. CAR-T cells were first exposed to target cells (ratio 5:1) and allowed to engage and eliminate the targets over a period of 24 h. Post initial challenge, CAR-T cells were re-isolated and re-challenged with a fresh batch of target cells three times (2nd, 3rd and 4th challenge). (B) Graph shows grouped analysis of CAR-T cell cytotoxicity during 4th challenge. Values are from 5 independent measurements. (C) Proliferation of CAR-T cells during the rechallenge experiment evaluated by total count of CD3+ T cells by flow cytometry. Values are from 4 independent measurements. (D-F) Exhaustion profile of the different CAR-T cells after 4 challenges evaluated by flow cytometry staining of PD-1, CTLA-4 and LAG-3 exhaustion markers. Values are from 4 independent measurements. Significance was assigned as follows: ∗p < 0.05, ∗∗p < 0.01 and ∗∗∗p < 0.001.

