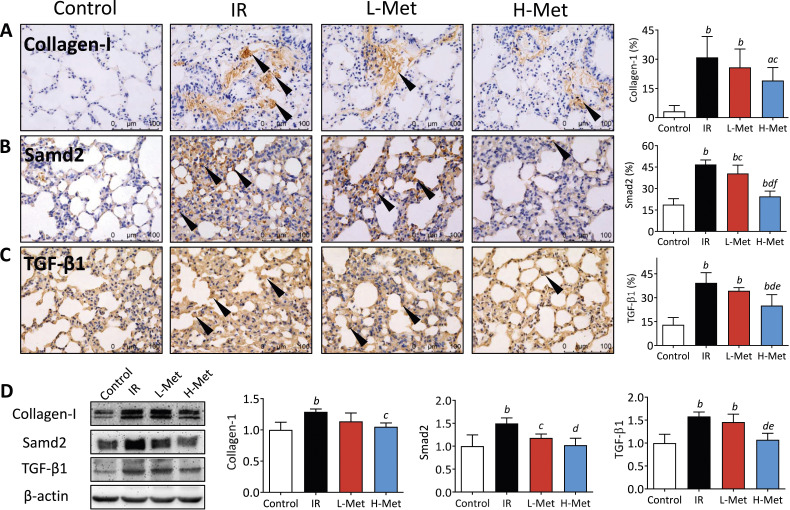
Figure 3.
Metformin mitigated radiation-induced lung fibrosis. (A)-(C) Representative images (40×) of immunohistochemical staining of Collagen-I, Samd2, and TGF-β1 and the percentages of their positive cells, black arrow: Collagen-I, Samd2, and TGF-β1 posotive cells. (D) Representative images of western blot of Collagen-I, Samd2, and TGF-β1 and their quantified calculation of protein expression. The results are presented as mean ± SD. a P < 0.05 vs Control group, b P < 0.01 vs Control group, c P < 0.05 vs IR group, d P < 0.01 vs IR group, e P < 0.05 vs L-Met group, f P < 0.01 vs L-Met group.

