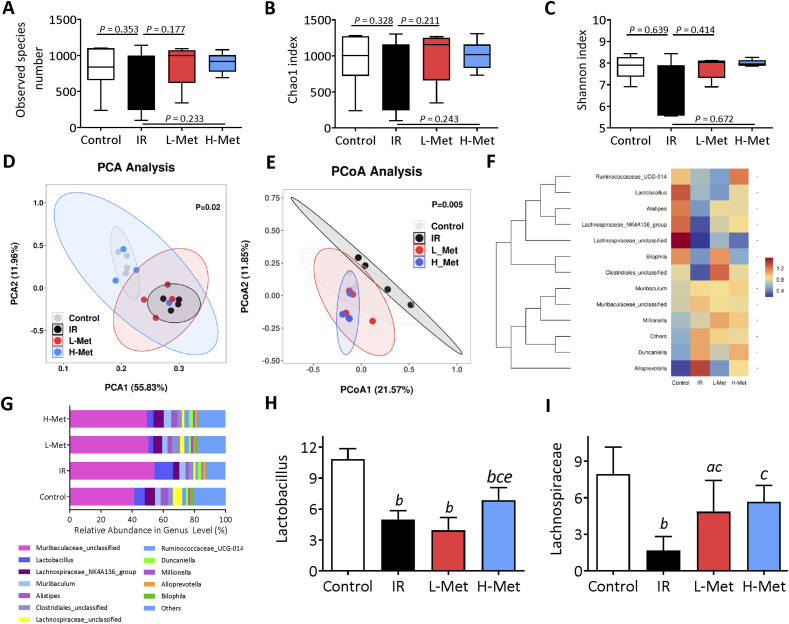
Figure 6.
The effects of metformin on intestinal gut microbiota. (A)-(C) The indexes of the abundance and diversity of intestinal gut microbiota bacterial, including the observed species number, Chao1 index, and Shannon index. (D) Principal coordinate analysis (PCA) of gut microbiomes. (E) Principal component analysis (PCoA) of gut microbiomes. (F) The differences in intestinal bacterial structure at the genus level among the groups (G) The relative abundance of bacterial flora at the genus level. (H) The relative abundance of lactobacillus. (I) The relative abundance of Lachnospiraceae-NK4A136. The results are presented as mean ± SD. a P < 0.05 vs Control group, b P < 0.01 vs Control group, c P < 0.05 vs IR group, eP < 0.05 vs L-Met group.

