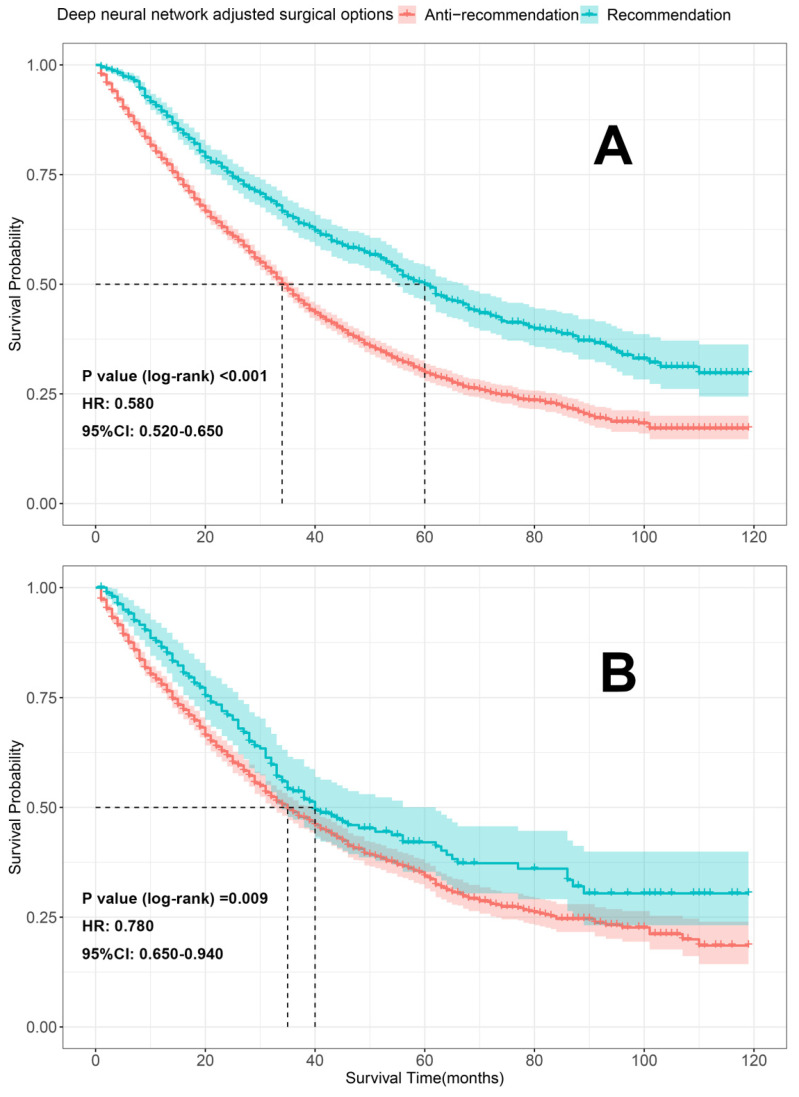
Figure 8.
K-M survival analyses comparing the differences in OS between the patients who received the recommendation and anti-recommendation therapy on the train and test sets (deep neural network model 1). A. K-M survival analyses on train set; B. K-M survival analyses on test set; HR: hazard ratio; 95%CI: 95% confidence interval.

