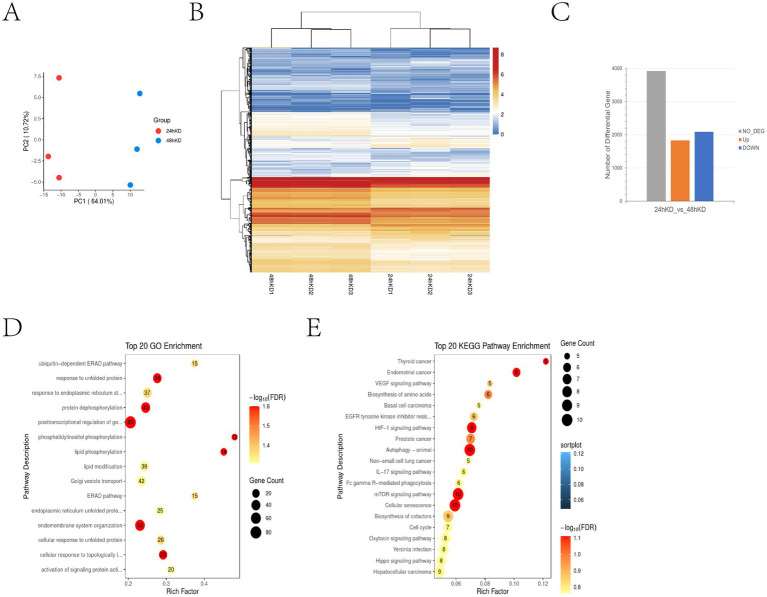
Figure 2.
Transcriptome sequencing revealed that S100A4 knockdown can activate the IL-17 signaling pathway (A) Principal Component Analysis (PCA) results show significant spatial separation between samples, indicating distinct gene expression profiles after different treatments. For PCA, the first two or three principal components (PC1, PC2) were used to represent the largest variances in gene expression, which allows for clearer differentiation between sample groups. (B) Heatmap analysis of gene transcription differences at 24 and 48 h after S100A4 knockdown. The heatmap colors range from blue to red, with blue representing lower expression (log2 fold change) and red representing higher expression. (C) Differential gene expression statistics indicate that the number of up-and down-regulated genes (~2,000 each) occurred 24 and 48 h post-S100A4 knockdown. (D) GO enrichment analysis highlights key functions, such as post-transcriptional regulation and endomembrane system organization. (E) KEGG pathway enrichment identifies IL-17 signaling and pathways related to autophagy and cellular senescence. -log10 (FDR) was used to illustrate the FDR value, with larger values indicating greater statistical significance.

