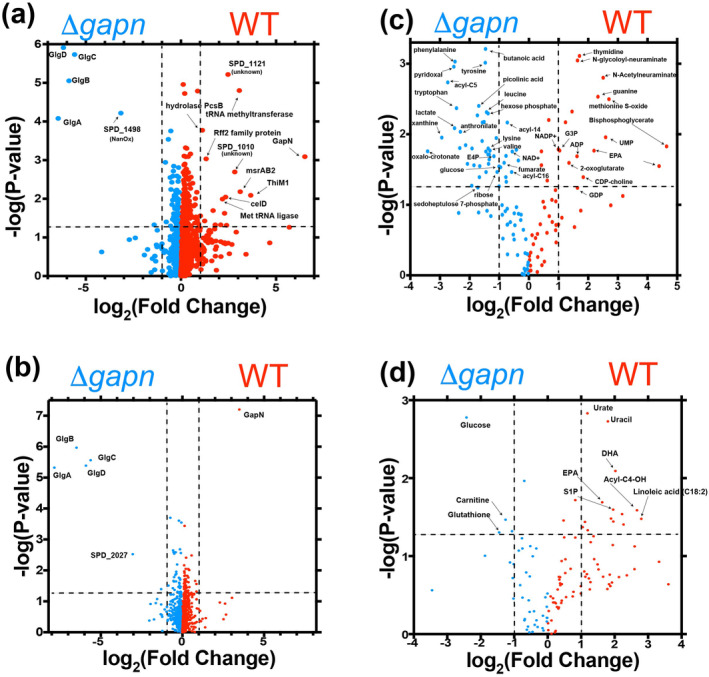
FIGURE 6.

Proteomic and metabolic changes due to S. pneumoniae GAPN knockout. (a) Volcano plot indicating proteins that increase (blue, left) and decrease (red, right) upon GAPN knockout of cells grown in culture. (b) Volcano plot indicating proteins that increase (blue, left) and decrease (red, right) upon GAPN knockout for cells derived from infected mice. (c) Volcano plot indicating metabolites that increase (blue, left) and decrease (red, right) upon GAPN knockout of cells grown in culture. (d) Volcano plot indicating metabolites that increase (blue, left) and decrease (red, right) upon GAPN knockout derived from the BAL fluid of infected mice. Intensities were derived and compared in triplicate between WT and GAPN knockout strains.
