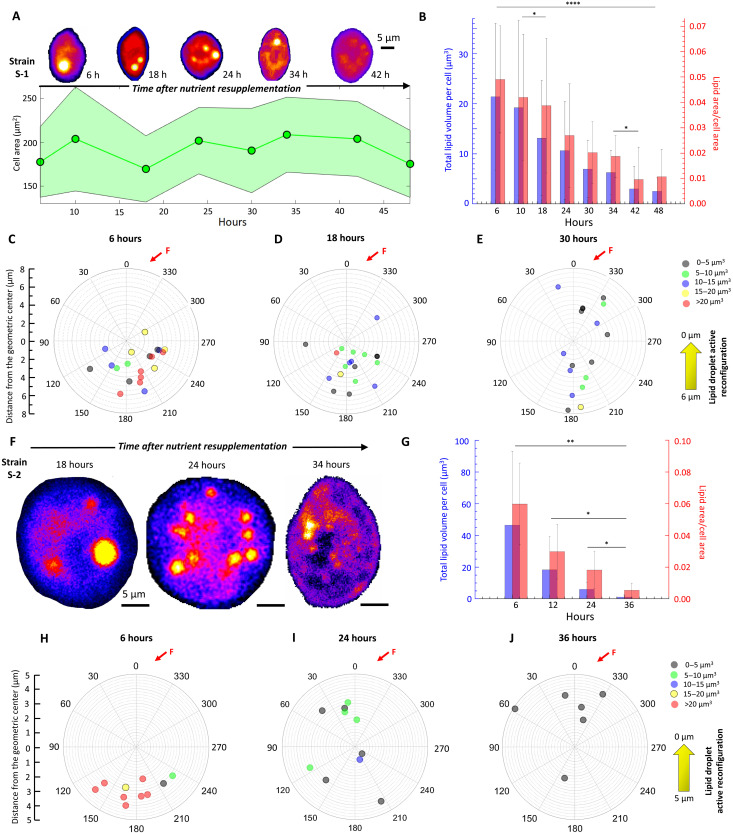
Fig. 2. Active reconfiguration of LDs upon nutrient reincorporation.
(A) Nutrient reincorporation of S-1 leads to LD lipolysis (false color bright spots), while the cell area remains stable over time. LDs translocate from the aft-to-fore direction, reversing the direction of LD mobility under depleted conditions. (B) Normalized lipid area, ILD, reduces from 0.049 ± 0.021 to 0.01 ± 0.01 within ~48 hours (inset shows the total LD volume per cell, VLD, over time). One-way ANOVA between 10, 18, and 24 hours, t test between 34 and 42 hours, P < 0.001; asterisks indicate significant difference. (C to E) Evolution of LD size and coordinates within individual S-1 cells after nutrient reincorporation, shown for t = 6 hours (C), 18 hours (D), and 30 hours (E), respectively, measured relative to CB (center of the plot). LDs translocate from the bottom to the top of the cell (F indicates flagellar position). (F) Nutrient reincorporation drives lipolysis and LD translocation along the aft-to-fore direction in S-2. (G) ILD reduces from 0.06 ± 0.025 before reincorporation to 0.005 ± 0.004 at t = 36 hours. Inset shows the total LD volume, VLD, over time. One-way ANOVA between 12, 24, and 36 hours, t test between 24 and 36 hours, P < 0.001; asterisks indicate statistically significant difference. (H to J) LD coordinates relative to CB for t = 6 hours (H), 24 hours (I), and 36 hours (J) capture the active reconfiguration of the LDs due to nutrient reincorporation.

