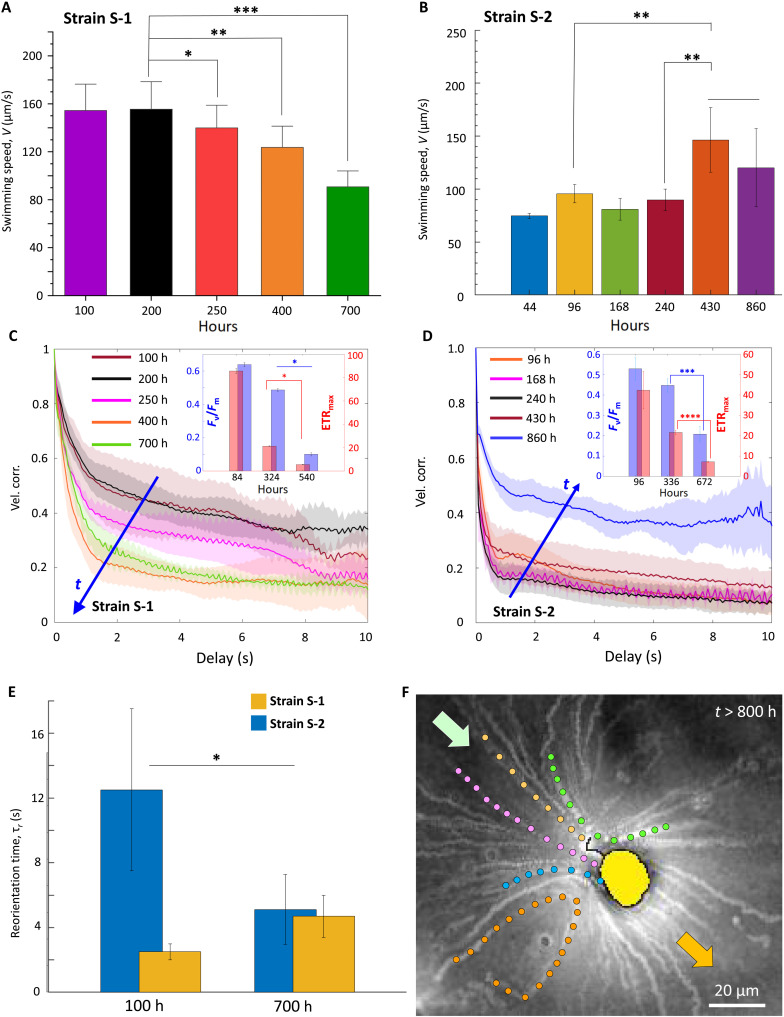
Fig. 3. Reconfigurable LDs govern migration of nutrient-limited phytoplankton.
(A) V decreases significantly for nutrient-limited S-1 (t > 200 hours). One-way ANOVA, P < 0.001, post hoc Tukey’s honest significant difference between exponential (100 and 200 hours), late exponential (250 hours), and stationary (400 and 700 hours) growth stages. Bar plots represent mean V ± SD; one asterisk indicates significant difference relative to 100 and 200 hours; two (three) asterisks indicate significance relative to 100, 200, and 250 hours (100, 200, 250, and 400 hours). (B) V of S-2 (44 to 430 hours) reveals that nutrient-limited population migrates faster against gravity (t > 240 hours). One-way ANOVA between 96, 168, 240, and 430 hours, t test between 240 and 430 hours, P < 0.001; asterisks indicate significant difference. (C) Shift from ballistic (t = 100 hours) to diffusive (t = 700 hours) swimming as populations grow (velocity correlation increases along arrow). Inset: Reduction of Fv/Fm and ETRmax; t test for Fv/Fm and ETRmax, P < 0.001 (324 and 540 hours); asterisks indicate statistical significance. (D) S-2 velocity correlation increases under nutrient limitation (t = 430 hours, MSD plotted in fig. S14). Inset: Drop in Fv/Fm and the ETRmax captured in t test (336 and 672 hours, P < 0.001); asterisks indicate statistical significance. (E) Low τr indicates high stability at 100 hours (S-1); however, nutrient limitation reduces stability (700 hours). The trend is reversed for S-2. Bar plot represents mean ± SD; asterisk indicates statistical significance. Inset: Joint velocity distribution presents shift in vertical velocity between 100 hours < t < 700 hours for S-1; horizontal velocity remains ~0 μm/s. (F) S-1 generates feeding current (t > 800 hours), visualized as streaks of bacteria and particles getting transported by the current.

