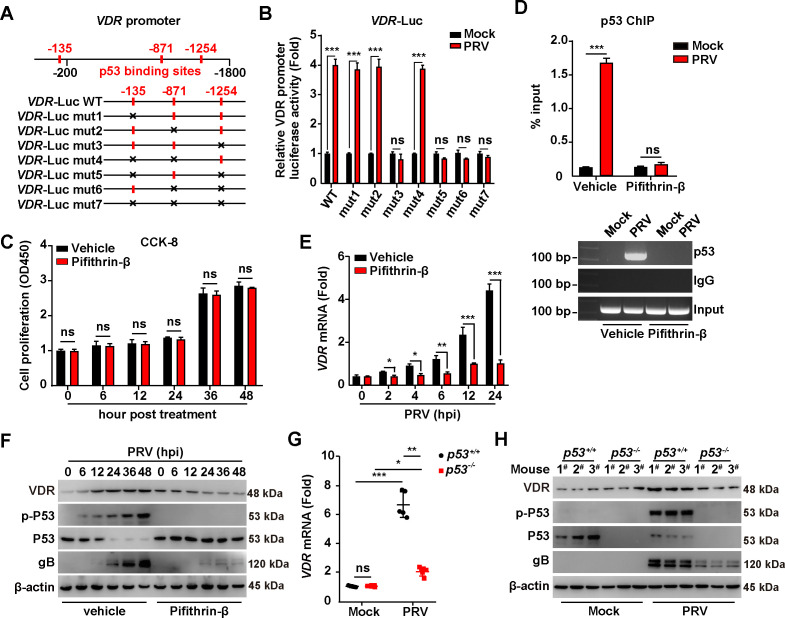
Fig 2.
PRV infection triggers VDR expression through p53 activation. (A) Schematic diagram of the VDR promoter with potential p53 binding sites and the various mutant constructions. (B) PK-15 cells were transfected with the indicated VDR-LUC plasmids for 12 h and then mock-infected or infected with PRV-QXX (MOI = 1) for 24 h. VDR promoter activities were analyzed by dual-luciferase reporter assay. ***P < 0.001. ns, no significance. (C) PK-15 cells were treated with vehicle or Pifithrin-β (10 µM) for 0–48 h. Cell proliferation was analyzed by CCK-8 assay. ns, no significance. (D) PK-15 cells were treated with vehicle or Pifithrin-β (10 µM) and simultaneously mock-infected or infected with PRV-QXX (MOI = 1) for 24 h. The interaction of p53 with the VDR promoter was analyzed using a p53 ChIP assay. ***P < 0.001. ns, no significance. (E) PK-15 cells were treated with vehicle or Pifithrin-β (10 µM) and simultaneously infected with PRV-QXX (MOI = 1) for 0–24 h. The mRNA levels of VDR were analyzed using qRT-PCR analysis. *P < 0.05, **P < 0.01, ***P < 0.001. (F) PK-15 cells were treated with vehicle or Pifithrin-β (10 µM) and simultaneously infected with PRV-QXX (MOI = 0.1) for 0–48 h. The protein levels of VDR, p-p53, p53, gB, and β-actin were analyzed by immunoblotting analysis. (G) p53+/+ and p53-/- mice were mock-infected or intranasally infected with PRV-QXX (5 × 10³ TCID50 per mouse) for 3 days. The mRNA levels of VDR in murine liver were analyzed by qRT-PCR analysis (n = 5). *P < 0.05, **P < 0.01, ***P < 0.001. ns, no significance. (H) The protein levels of VDR, p-p53, p53, gB, and β-actin were analyzed by immunoblotting analysis in murine liver from (G).

