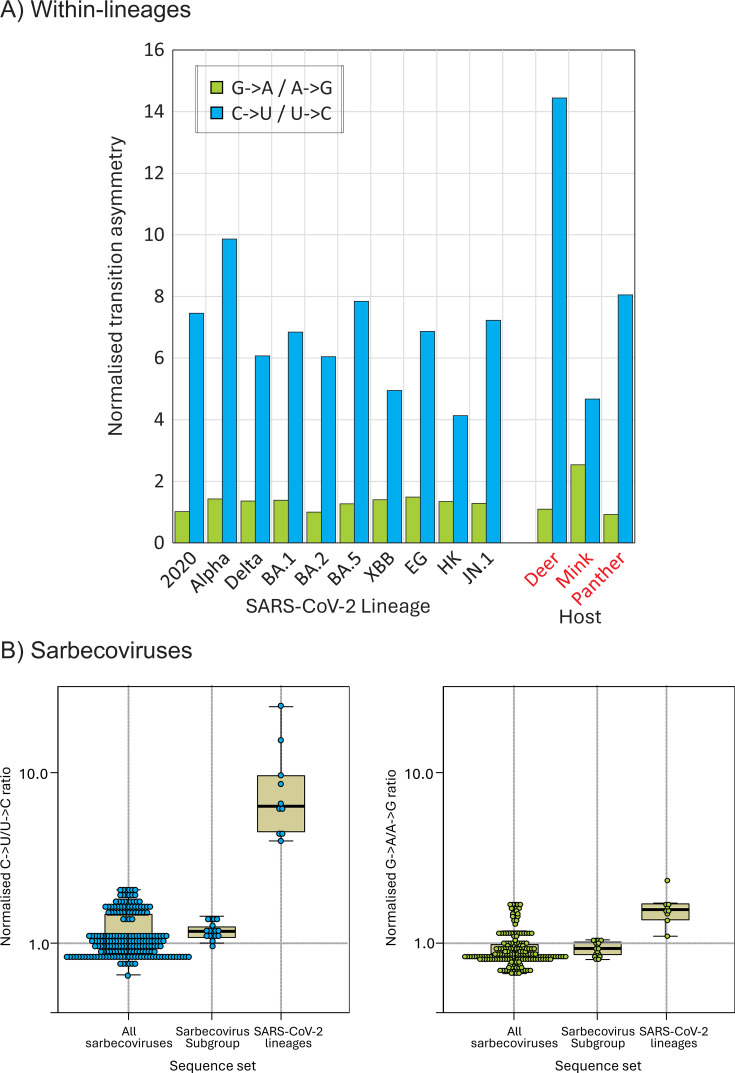
Fig 5.
Transition asymmetries with SARS-CoV-2 lineages. (A) Normalized transition asymmetries of fixed C→U and G→A substitutions within the 10 SARS-CoV-2 lineages. Comparisons with SARS-CoV-2 strain infections; non-human species shown on the right panel. (B) Normalized transition asymmetries of all sarbecovirus strains infecting bats (column 1), the subset (including RatG13) most closely related to human SARS-CoV-2 (column 2) and consensus sequences of lineages within SARS-CoV-2 compared to the prototype Wuhan-1 isolate sequence (column 3).

